A critical factor in setting a successful retirement income strategy is managing inflation risk.
Many retirees struggle to manage their cost of living because of the cumulative impact inflation can have on their financial position. Retirement income strategies should have some built-in inflation protection that can shield a member’s retirement income from inflation risks. A review of history demonstrates that this is not as always as easy as it sounds.
Maintaining the long-term real value of investments
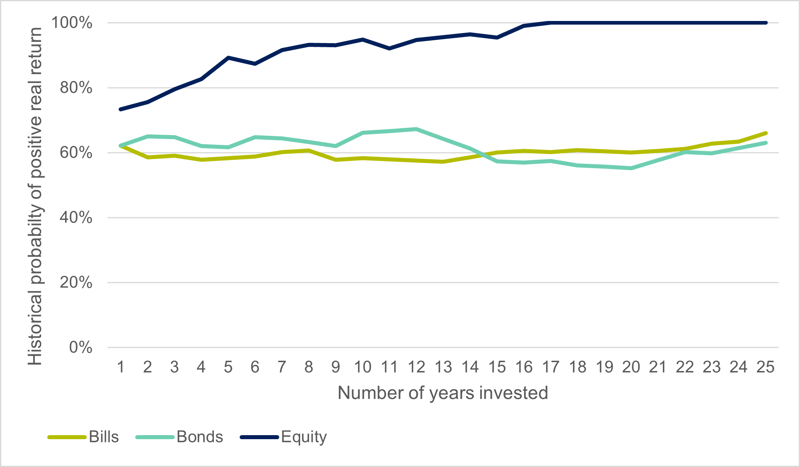
The key to a successful investment strategy is the ability to generate returns over the long term. Managing inflation is an important piece of the strategy. Long term investments need to be able to generate a real rate of return that provides growth in the investment value. The investments do not need to capture short-term inflation changes, but they need to offset the impact of inflation over time. Assets that are expected to do this are generally referred to as ‘growth’ assets. To demonstrate this, we can look at the historical performance of assets over the long run.1 Looking at Australian investment returns between 1900-2023, equities provided a return higher than inflation in 81 years which was 73% of the time. The one-year success rate for bonds and bills (cash) were lower, constrained by historical limits on bond yields. Both bonds and bills provided a one-year real return only 62% of the time in the same period.
The long run probabilities are shown in Figure 1. As the investment horizon extends out the probability of equities providing a real return increases. The higher returns on the investment eventually overcome any initial shortfall. Bond and bill investments show little improvement with a longer investment horizon. At horizons of 20 years, the probability of delivering a positive real return from nominal bonds was only 60%.2 Historically, all investment horizons of 16 years (and longer) have provided a positive real return for Australian equities. While history does not provide a guarantee, the increase shown in Figure 1 should provide confidence that a long-term investment in equities will provide real capital growth.
This analysis can be extended to diversified products such as a 70/30 growth fund (70% equities and 30% bonds) and a 50/50 balanced fund (50% equities and 50% bonds). These both show trend improvements over time, benefiting from the exposure to growth assets, but over longer periods. The 70/30 fund needed 20 years and the 50/50 fund 25 years historically to ensure the positive real return.
The portfolio comparison in retirement is important in the generation of income over longer periods. If income is taken as a set percentage of the balance then changes in income will directly link to market movements. This paper provides a historical basis to consider the inflation protection provided by these income streams. Historical investment performance is not a reliable indicator of future performance, but it is worth considering the timeframe for recovery from historical shocks.
Figure 1 Historical probability of positive real returns, 1900-2023

Source: Calculations, based on data from Morningstar, S&P, Bloomberg and ABS.
Inflation risk in retirement
Inflation is often called out as a risk in retirement that needs to be managed differently. Longevity and sequencing risks are also noted as being different, and these are not present in the accumulation phase. One of the challenges with managing inflation risk in retirement, is that inflation risk has a different impact on a portfolio in the retirement phase. Management of inflation risk in retirement needs a different approach. It is not just that capital needs to regain its real value, but every income payment needs to keep its value to maintain the target lifestyle of the retiree.
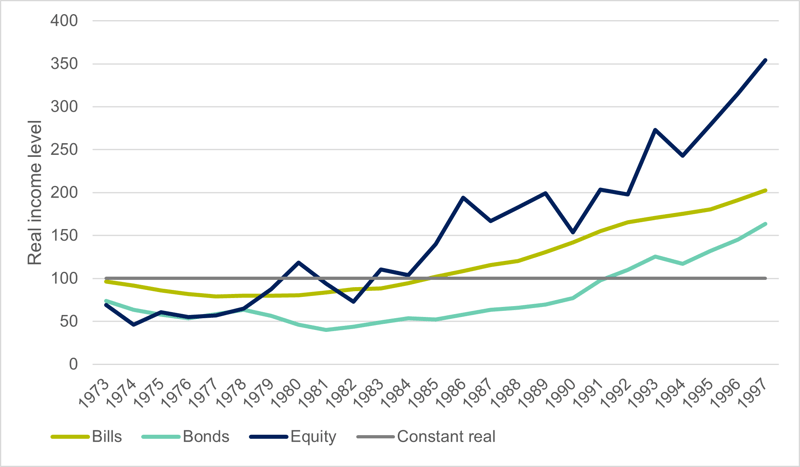
We can examine this difference by considering the outcome for someone who started to draw an income at the start of 1973. This was one of the worst years in the historical comparison (but not as bad as 1969) where the inflation spike meant that any investment-linked income would be falling in real terms in the first year. If a retiree’s income was linked to an investment, the real value would have declined for any of the three assets: Bills by 3.5%; Bonds by 26% and Equities by 30.7%. What happens over time is the recovery in the level of income. Income linked to equity performance briefly exceeds the original value in 1980 but dips again before maintaining real gains from 1983. Bills provide higher real income from 1985 while bonds will take until 1992. The 19-year impact on bonds highlights the exposure that nominal bonds have to inflation risks. The pattern for income linked to the different markets from 1973 can be seen in Figure 2.
Figure 2 Investment-linked income example

Source: Calculations, based on data from Morningstar, S&P, Bloomberg and ABS.
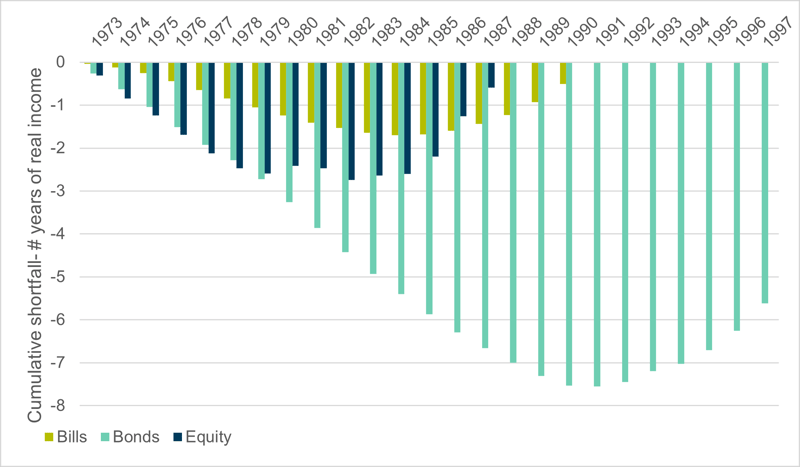
There is more at stake for retirees. The impact is not just the length of time to recover the real capital value, but the income that is lost over that period. For the nine years that the real equity-linked income is under the starting point, a retiree needs to reduce their lifestyle or run their capital down early. The lifestyle shortfall is shown in Figure 3. It highlights the cumulative shortfall in income, relative to the initial lifestyle of the retiree. The starting point is where inflation risk creates an impact which might be after the start of retirement.
The shortfall highlights the extent of the impact from an inflation shock. The worst performance is from bonds, where more than 7 years of income (lifestyle) were lost over a 17-year period before a modest recovery. For equity-linked income, nearly three years of lifestyle were lost over nine years. While there was a strong recovery after, this is an average of a third of total spending that needs to be cut for an extended period. Cash investments took longer to fully recover, but the extent of the pain was not as large. The worst point is ten years after the shock, where the retiree has missed 1.7 years of real spending.
Figure 3 Cumulative shortfall in real incomes

Source: Challenger calculations, based on data from Morningstar, S&P, Bloomberg and ABS.
A solution for superannuation funds
Management of inflation risk in retirement requires a different approach to managing for growth in accumulation. It needs to be achieved at the member level in retirement. A scalable solution is available for superannuation funds to address this risk as part of a broader retirement income strategy.
Challenger can assist superannuation funds to address inflation risk faced by retiring members in retirement with an institutional insurance arrangement called a Group Annuity.
Challenger’s Group Annuity solution enables superannuation funds to provide inflation-protected lifetime income to retirees at an individualised level and is designed to be blended with your account-based pension. Funds can utilise Challenger’s experience in implementing Group Annuity solutions to design and implement their own lifetime pension for members.
Summary
Protecting an investment portfolio from inflation can be an important concern for any investor. In retirement, the challenge increases as a retiree needs to protect their income stream to be able to sustain their lifestyle. While some investments can protect against inflation over the long run, market-linked investments don’t necessarily protect an income stream from inflation over the short to medium term. Retirees who are concerned about inflation risk should consider options that can directly manage inflation.
1 The historical data in this paper comes from the Dimson, Marsh and Staunton dataset as provided by Morningstar. Recent data on indices relates to the S&P/ASX 200 Accumulation index, Bloomberg AusBond Composite 0+Yr Index and Bloomberg AusBond Bank Bill Index. Recent inflation data is the CPI sourced from the Australian Bureau of Statistics.
2 The majority of these periods were between 1933 and 1973 when bond yields were set by regulation.
Related content

Federal Budget 2024-25 Report

Retirement phase of superannuation
