Subscribe to Macro Musing
To stay up to date on the latest economic insights, subscribe to Macro Musing on LinkedIn.
Aggregate inflation peaked at 8% last year, has averaged over 5% for the past 2½ years, and the RBA doesn’t expect inflation to return to its 2–3% target until late 2025. We have a significant inflation problem.
High inflation has seen significant declines in real wages and real incomes. But not all prices have increased by the same amount, for example over 2½ years the cost of holiday travel and accommodation increased by 172% but the cost of public transport fares fell by 20%. Given varied price increases and differing spending patterns of households, this raises the question: have some households escaped high inflation? The short answer is no. All household types have experienced very similar and significant inflation over the past three years.
The ABS publish data on living costs for five different household types covering retirees, other welfare recipients and working families (see Figure 1 and Table 1).
Figure 1
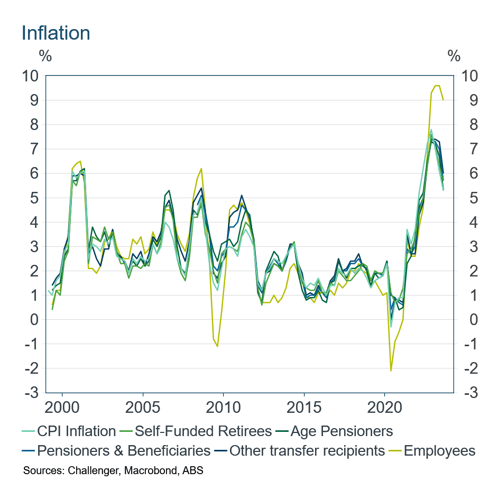
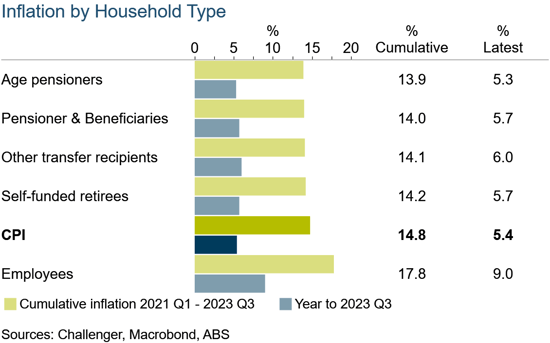
Table 1
These living cost indices have some conceptual differences to CPI inflation, the biggest of which is that living cost indices include mortgage interest payments while the CPI does not (by contrast the CPI includes the purchase cost of new dwellings). The inflation rates for the five types of households display the same cyclical movements over time as CPI inflation (Figure 1).
The one household type which at times experienced significantly higher or lower inflation than others is households headed by a working person, who have more mortgage debt on average and so changes in interest rates result in very large changes in their expenditure. Over the past 2½ years cumulative inflation for employee households has been almost 18% given rising interest rates. By contrast, self-funded retirees, Age Pensioners and other welfare recipients have experienced cumulative inflation of 14%.
The similarity in inflation rates reflects that while there are differences in households’ spending patterns and some of the prices they face, these tend to wash out in overall price changes. The differences in spending patterns by household types are summarised by the living cost weights in Figure 2.
Figure 2
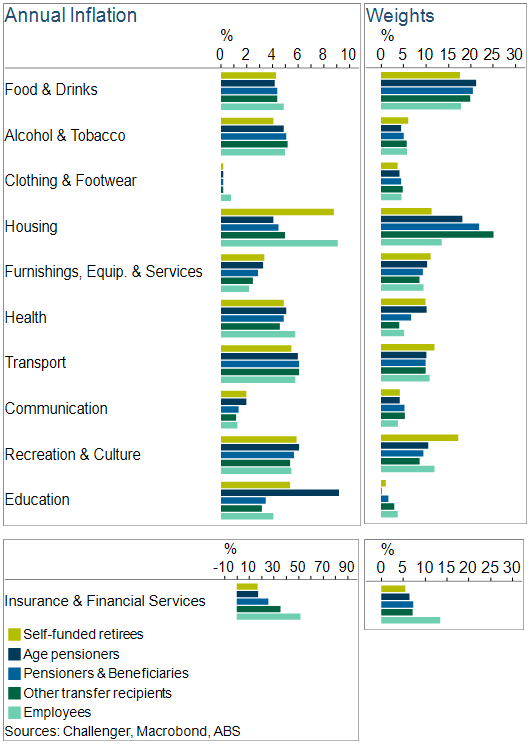
For example, self-funded retirees spend proportionately more on health and recreation but less on housing, given many own their own home. Since the prices of similar types of goods (e.g., types of clothing) tend to have similar changes, the biggest difference in component inflation rates comes from the subsidies that some households receive but others don’t. For example, electricity prices increased by some 25% in the September quarter in the eastern states, but some households received significant bill relief payments, so welfare recipients had lower ‘housing’ inflation than self-funded retirees and employees. But as Figure 2 shows, these differences average out in the inflation rates for different types of goods and services for the different household types.
All up, all households have experienced substantial inflation over the past 2½ years and will face high inflation for at least the next couple of years.
Related content

How bad are recessions for asset returns?

Inflation expectations: alert but not (yet) alarmed