

Download the full article below.
Yet for many retirees, that flexibility creates a new challenge: determining how much income they can or should spend each year.
The evidence suggests that a large proportion of retirees solve this challenge by doing the simplest thing possible and drawing the legislated minimum pension amount each year.
According to the Grattan Institute1, around half of retirees using account-based pensions draw only the minimum required amount, despite many having substantial retirement savings. Grattan estimates that drawing only the minimum could leave a typical retiree with approximately 65% of their super balance remaining when they reach an average retiree’s life expectancy.
The question for advisers is whether drawing the minimum represents good retirement planning.
In the absence of advice many retirees treat the SIS minimum as a recommendation. Several behavioural factors help explain why including:
Fear of running out of money – Retirement is unique because clients must fund an unknown lifespan. Without certainty around longevity, many retirees respond by spending conservatively.
Lack of confidence to spend – The transition from saving to spending is psychologically difficult. Clients often tell advisers:
The result is an understandable tendency to underspend.
The SIS minimum appears to have Government endorsement – In the absence of any retirement spending roadmap, clients often view the minimum pension percentage as implicit Government guidance. If the law says a 67-year-old must withdraw at least 5%, many assume 5% must somehow be the “right” amount.
Sequencing risk and market uncertainty – Clients understand intuitively that poor investment returns early in retirement can permanently reduce future income. Drawing only the minimum can feel safer because it preserves more capital during periods of market volatility.
There can be genuine advantages to drawing only the minimum required pension from an ABP, particularly where a client values flexibility, capital preservation or leaving an inheritance.
Capital preservation – Where investment returns exceed the minimum pension withdrawal rate, the account balance may remain relatively stable or continue to grow over time.
Greater liquidity – Retirement savings remain readily accessible to meet unexpected expenses, aged care costs, health needs or financial assistance for family members.
Larger estate outcomes – Clients with strong bequest objectives may prefer to preserve a larger proportion of their retirement capital for beneficiaries.
Some protection against longevity risk – Drawing income conservatively may reduce the risk of exhausting retirement savings during a long retirement.
The drawbacks of choosing to draw the minimum from an ABP may be outnumbered by the advantages, but the potential impact of this disadvantage can be significant.
Lower lifestyle and retirement enjoyment – Many retirees spend less than they could comfortably afford. For many retirees this represents a lost (and potentially very significant) opportunity.
Rather than viewing retirement as a choice between spending more and preserving capital, advisers can reframe the problem.
The real issue is that clients are trying to manage:
Managing these risks and objectives with an ABP can be difficult and, for many clients, the combination of ABP and lifetime income stream can improve retirement outcomes for clients.
In such cases the allocation to an ABP provides:
The lifetime income stream provides secure income for life regardless of investment markets (depending on the type of lifetime income stream) or how long the client lives.
When essential expenses are covered by guaranteed income sources (Age Pension plus lifetime income stream), clients are often more willing to spend from their ABP.
Research and retirement modelling show that guaranteed income allows retirees to draw more confidently from their retirement savings because their priority expenditure (and the retirement lifestyle it supports) is protected.
Rin and Ren are a 67-year-old couple. They have recently retired. They’ve worked hard and are now looking forward to having a whole lot more time to do the things they love. They are active, interested and involved.
Rin and Ren own their own home and are free of debt. They have $500,000 each in superannuation invested in accordance with their 50/50 growth/ defensive risk profile. They have $50,000 in cash and term deposits and $20,000 worth of personal assets.
Rin and Ren are concerned about running out of income during their lifetimes. On rolling over their accumulated superannuation to ABPs they choose to draw the minimum required payments.
Retirement income from all sources for Rin and Ren is shown in the projection (from the Challenger retirement Illustrator2) below:

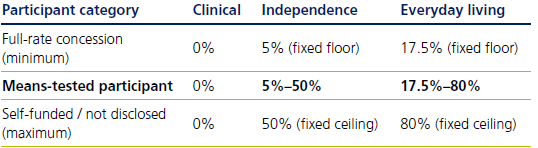
Financial assets are assessed under both the assets test and the deeming rules used in the income test. As a result, individuals with financial assets exceeding $192,400 may be assessed as means-tested participants, even though this threshold remains well below the $333,000 asset free area.
This first milestone highlights the range where a participant’s assessable income and assets can affect their Support at Home contribution rates. Understanding these thresholds can help advisers identify when strategies that alter assessable income or assets may influence contribution outcomes.
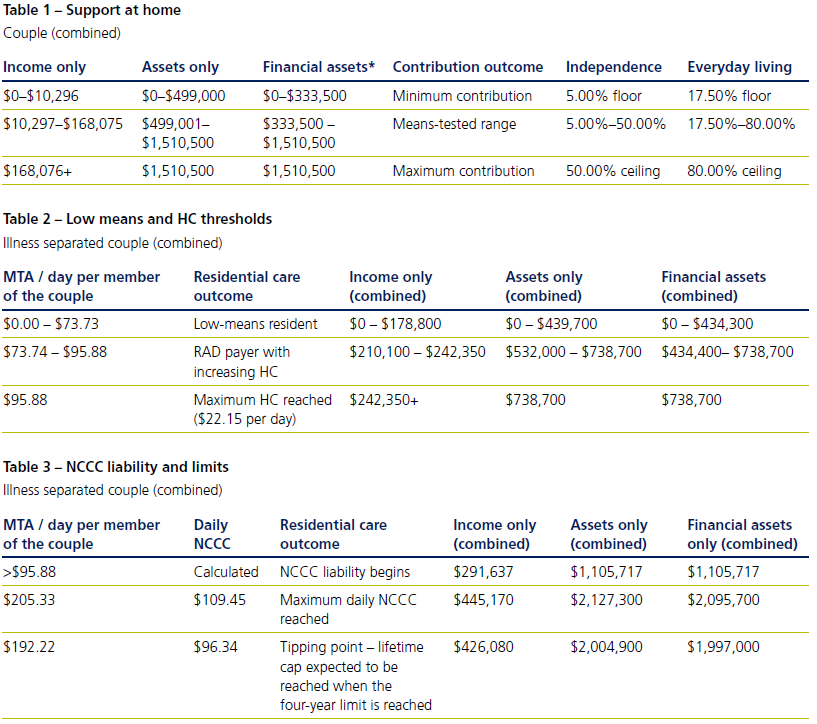
Refer to the table 1 in the Appendix for couple thresholds.
At age 85, Margaret’s care needs increase and she moves into residential aged care. The aged care facility has an advertised accommodation price of $750,000. She keeps her former home which remains vacant. At this point, the focus shifts from Support at Home participant contributions to the means tested assessment (MTA). Under the residential aged care rules, the MTA becomes the key measure used to determine accommodation payments and ongoing contributions. The first important threshold represents when the MTA equals the Maximum Accommodation Supplement (MAS) of $73.73 per day, at which point a resident is classified as a RAD payer. HC does not begin immediately when a resident becomes a RAD payer. HC only starts once the MTA exceeds the MAS ($73.73 per day). The second stage represents the range over which HC applies and increases as a resident’s means increase. The third threshold occurs when the MTA reaches $95.88 per day, at which point the HC reaches its maximum daily amount of $22.15 and caps out.
For a single resident, the key thresholds are:
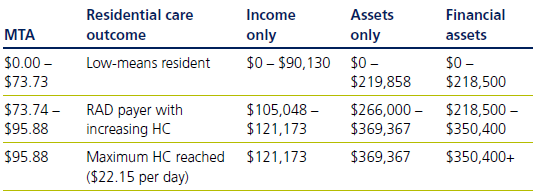
For Margaret, this milestone confirms that she is not classified as low means. Even before taking deemed income into account, her assessable assets of approximately $739,858 (comprising $520,000 of financial assets and the capped value of $219,859 for her former home) exceed the thresholds for both RAD payer status and the maximum HC. As a result, Margaret would:
Understanding the underlying income and asset levels provides a practical reference point for identifying when an individual is likely to be assessed as low means or RAD payer before they enter residential care. This milestone therefore establishes a resident’s status upon entry into an aged care facility and provides the foundation for understanding further ongoing costs, where the focus shifts from
accommodation payments to liability for the HC and NCCC.
Refer to the table 2 in the Appendix for illness separated couple thresholds.
The first two milestones focus on the points at which means testing starts to affect a client’s contributions under Support at Home and residential aged care. This final milestone focuses on when NCCC liability begins and the interaction between the three limits that apply to the NCCC:
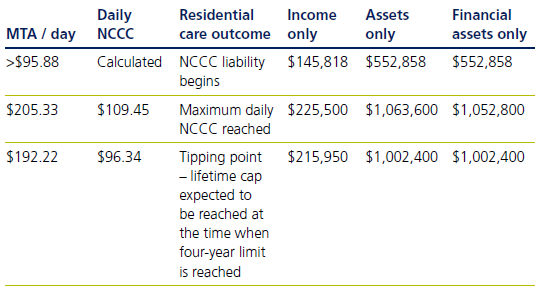
For a single homeowner resident, the key thresholds are:
The first threshold represents the point at which NCCC liability begins, The NCCC begins once the HC has reached its maximum and continues to increase as the resident’s means increase, up to the maximum daily NCCC of $109.45 per day. In addition to the daily cap, a resident ceases paying the NCCC when the earlier of the lifetime cap (currently $140,652.80) or paying NCCC for a minimum of four years is reached. For RAD paying residents, understanding which limit is likely to apply first becomes increasingly important.
The second threshold is particularly important when considering whether disclosure of means is likely to influence aged care costs. At this point, the interaction between the daily cap, lifetime cap and four-year limit no longer changes the resident’s daily NCCC outcome, as the maximum daily contribution has already been reached. This makes the threshold a useful reference point when assessing whether disclosure of means is likely to change the resident’s aged care outcome. Clients whose means already place them at the maximum HC and maximum NCCC generally arrive at the same fee outcome regardless of whether they disclose their means.
The third threshold represents the tipping point between the lifetime cap and the four-year contribution limit. At this approximate point, both limits are expected to be reached at the same time.
Below the tipping point:
Above the tipping point:
In practical terms, increasing a resident’s means beyond this point is unlikely to increase the total NCCC ultimately paid.
Refer to the table 3 in the Appendix for illness separated couple thresholds.
Margaret sells her former home for $1.6 million after entering residential aged care. Combined with her existing financial assets of $520,000, she now has total financial assets of approximately $2.12 million. Based on the thresholds identified above, Margaret’s financial assets significantly exceed the level required to reach the maximum daily HC and NCCC. Further increases in her assessable income and assets will not increase her ongoing contributions because she has already reached the legislated maximum contribution.
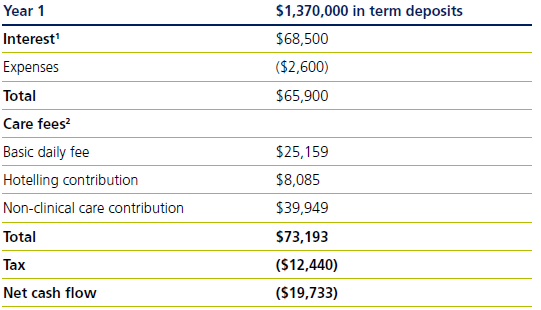
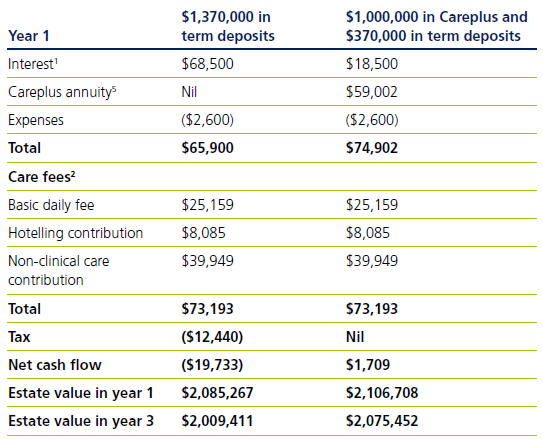
Margaret decides to pay a $750,000 RAD and invest $1.37 million in term deposits. She will have expenses of $50 per week while living in residential aged care. The following table provides her cash flow in year 1.
Margaret wants to address her cash flow deficit and maximise her estate in the event of her death. The following table compares her cash flow and estate value in year 1 if $1 million is invested in Challenger CarePlus (CarePlus). CarePlus is a combined lifetime annuity (CarePlus Annuity) and life insurance policy (CarePlus Insurance) which can be purchased by aged care clients3. CarePlus Annuity provides guaranteed regular payments for life and CarePlus Insurance provides a guaranteed death benefit of 100% of the amount invested, payable to nominated beneficiaries or the estate in the event of the client’s death4.
The comparison outlines that for a resident already paying the maximum HC and NCCC, the key consideration becomes improving after-tax cash flow rather than reducing aged care fees. Both strategies result in the same HC and NCCC liability, however the CarePlus strategy produces a materially better after-tax outcome. Under the term deposit strategy, Margaret incurs $12,440 of tax and experiences a first-year cash flow shortfall of $19,733. On the other hand, the CarePlus strategy results in no tax liability and a first-year cash flow surplus of $1,709, improving Margaret’s cash flow position by $21,442.
The improvement is also reflected in Margaret’s projected estate value. In year 1, the CarePlus strategy increases the value of Margaret’s estate by $21,441 ($2,106,708 less $2,085,267). By year 3, the projected benefit in estate value under the CarePlus strategy improves to $66,041 ($2,075,452 less $2,009,411).
1https://grattan.edu.au/report/simpler-super/
2Source: Challenger Retirement Illustrator, 5 October 2026. RIC261005000133.
See Challenger Retirement Illustrator for all assumptions.
3ASFA Retirement Standard for those aged 65-84 (June quarter 2026).
Source: https://www.superannuation.asn.au/consumers/retirement-standard/
4Source: Challenger Retirement Illustrator, 5 October 2026. RIC261006000484.
See Challenger Retirement Illustrator for all assumptions.
