More resources for advisers
Our Challenger Adviser Knowledge Hub has a large range of resources for advisers including product and technical information, articles and guides.
Recessions come and go, but they can have significant effects on people’s current livelihood because of unemployment and future livelihood through the impact on asset prices and so wealth.
Given the very sharp increases in interest rates over the past two years, and the largest inflation shock in decades, many analysts have been expecting recessions around the world. However, the resilience of output, and in particular labour markets, has increased the chance for soft landings. But in Australia GDP per capita declined over the first half of this year so based on a sensible definition of a recession, Australia already has been in a mild recession.1 What does this mean for asset prices?
Recessions are typically preceded by a period of exuberance with brisk economic growth and high consumer and business confidence which leads to strong corporate profits and demand for financial and real assets. This environment of high investor optimism typically results in strong asset returns. But fast economic growth reduces spare capacity in the economy adding to wage and price growth and leading the central bank to increase interest rates. Frequently this necessary medicine has unfortunate side-effects. Eminent economist Rudi Dornbusch wrote about the United States that “none of the post-war expansions died of natural causes--they were all murdered by the Fed over the issue of inflation”.2
During a recession the economy contracts and unemployment rises, with consumer spending and corporate profits declining. With a deterioration in economic fundamentals, and a dose of pessimism, asset price growth slows or prices even contract. The recovery from a recession typically sees a strong rebound in economic activity, and a resumption of confidence, leading to higher asset price growth.
Australian asset returns from the past four decades demonstrate this pattern.
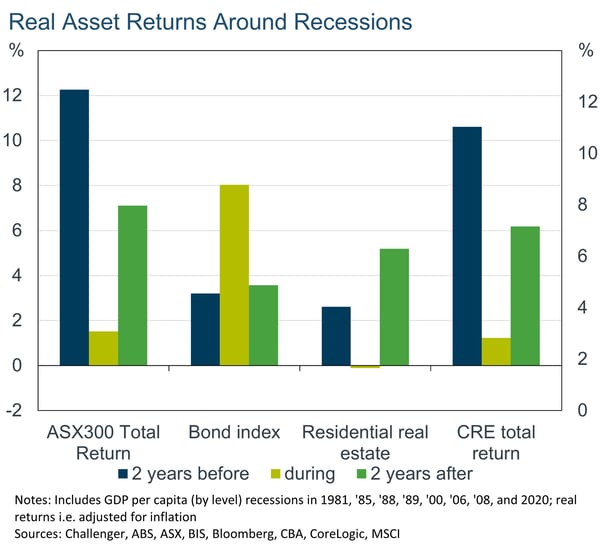
Over 8 recessions, real total returns for equity (i.e. including dividends and adjusted for inflation) have exceeded 12% on an annualised basis in the 2 years prior to recessions, falling to 1.5% during recessions, before picking up to just over 7% in the two years after recessions. Commercial real estate returns show a very similar pattern, with pre-recession double digit returns falling to 1% in the recession before returns pick back up but remain below those of the pre-recession period.
There has been a similar decline in residential real estate prices (i.e., excluding rents), but interestingly price growth has historically been stronger after the recession than before. The one asset class that shows a different pattern of returns is not surprisingly bonds. Bond returns have on average picked up significantly in recessions as cuts in central bank interest rates and slower growth lead to falls in long term interest rates and so rising bond prices.
This pattern of falling returns for risky assets in recessions is found around the world, and over time. The United States has a long history of data available, and of recessions. For the 29 recessions from 1873 to 2007 the average annualised real return of the S&P 500 is 5% before the recession, falling to –6% during the recession and bouncing back up to 6% after the recession. Interestingly in this large sample of recessions there is no relationship between the size of the fall in prices in the recession and either the extent of exuberance in returns before the recession or the strength of returns after the recession.
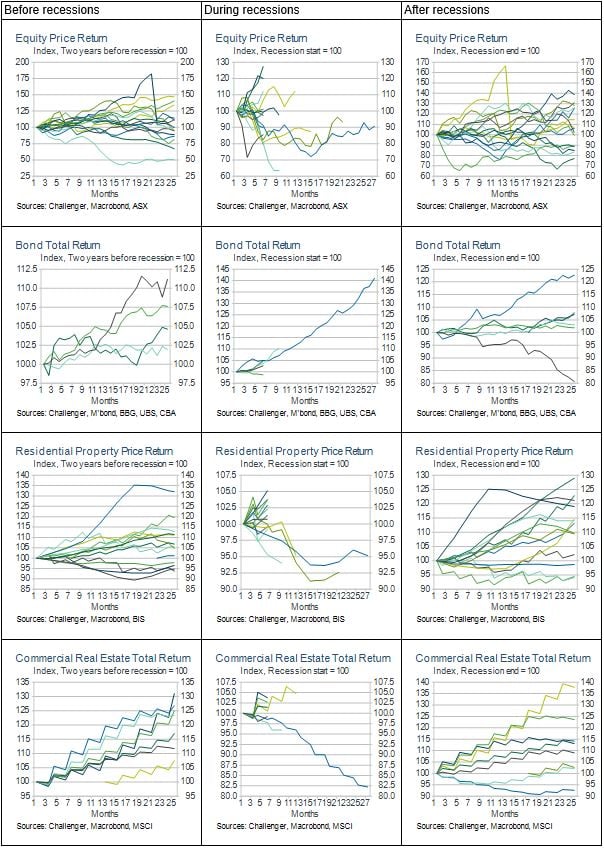
Of course, every economic cycle is different with a range of factors influencing the returns of different assets. The averages discussed above summarise the wide range of outcomes for asset returns in recessions over the past four decades. There is no certainty that markets respond in line with these averages in any recessions, or before or after. Appendix A shows the wide range of different asset returns before, during and after each of the recessions over four decades (using the business cycle definition of recessions based on falls in the level of per capita GDP).
The current recession has been very mild to date. It may well end up being the recession we had to have (given high inflation) but didn’t notice (given low unemployment). So how have assets performed in this mild recession?
The two years prior to 2023 included COVID lockdowns and very high inflation so not surprisingly real asset returns were lower than historical averages. Annualised returns were 5% for equities, 2% and –2% for residential and commercial real estate, and –10% for bonds given the rise in interest rates from the exceptional lows of the pandemic when central bank quantitative easing pushed bond yields to exceptionally low levels. Assuming 2023 is a recession and data revisions don’t affect that classification, returns for the year-to-date are somewhat different from the usual recession pattern. Real equity annualised returns have been –12% given price falls and strong inflation, while residential real estate prices have defied their usual anaemic growth with over 5% annualised real growth and the further rise in long interest rates has seen bonds defy their usual defensive asset status with annualised returns of –8%.
With rates likely to stay high or even go higher in the near term, it’s possible the current mild recession drags on for a few more quarters. We may yet see more typical recession asset returns. Time will tell.
Appendix A: Asset returns using the business cycle (Bry-Boschan) recession definition
1 GDP per capita only declined by about ½ percentage point over the first half of the year, so it is possible that with revisions to GDP (and even population) that this recession could be revised away. We’ll see.
2 Dornbusch (1998) Wall Street Journal.
Related content

Is inflation higher for some households?

Inflation expectations: alert but not (yet) alarmed