Australia’s housing prices rise as supply falls short

Subscribe to Macro Musing
To stay up to date on the latest economic insights, subscribe to Macro Musing on LinkedIn.
Dwelling prices in Australia have increased by 10% over the past year, continuing to outpace growth in household incomes deepening the affordability crisis. Interest rates influence cyclical movements in housing prices, but the overall level of prices ultimately reflects structural factors, particularly housing supply and households’ willingness to pay.
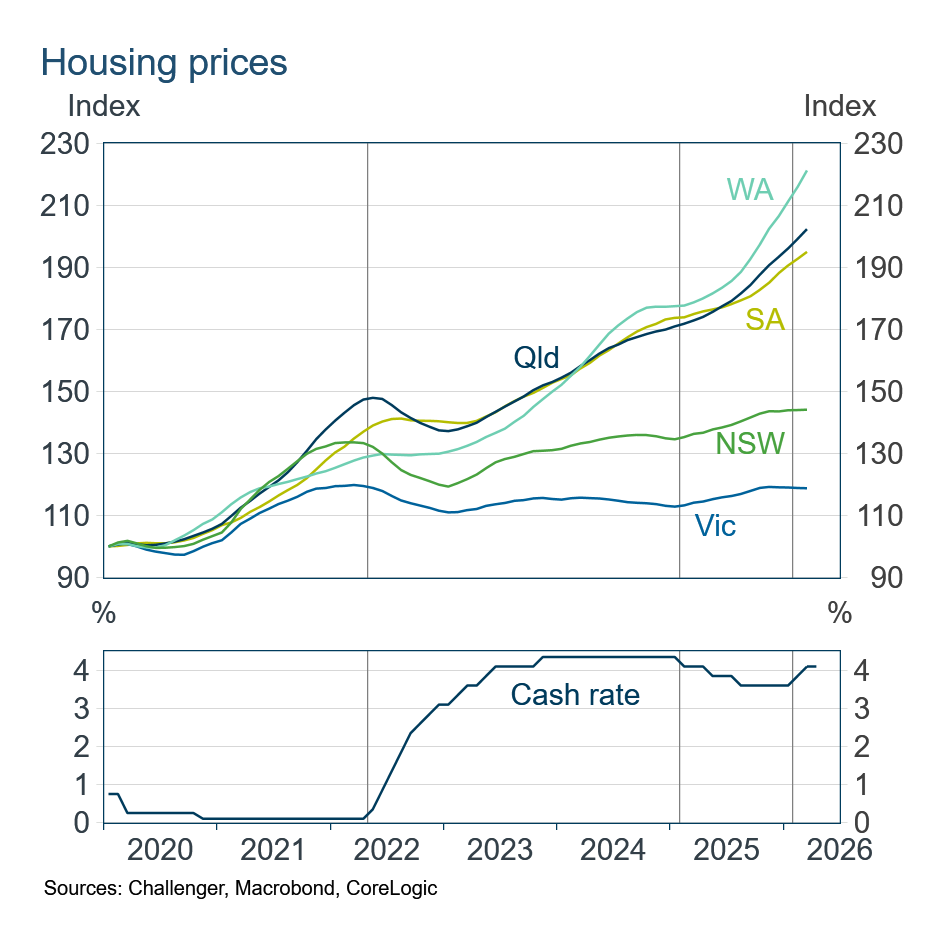
Price growth has varied markedly across the five largest states underscoring how evolving structural factors impact prices. Over the past year, dwelling prices are up 24% in Perth and 19% in Brisbane. By contrast, prices in Sydney and Melbourne recorded growth of less than 5%, consistent with income growth.
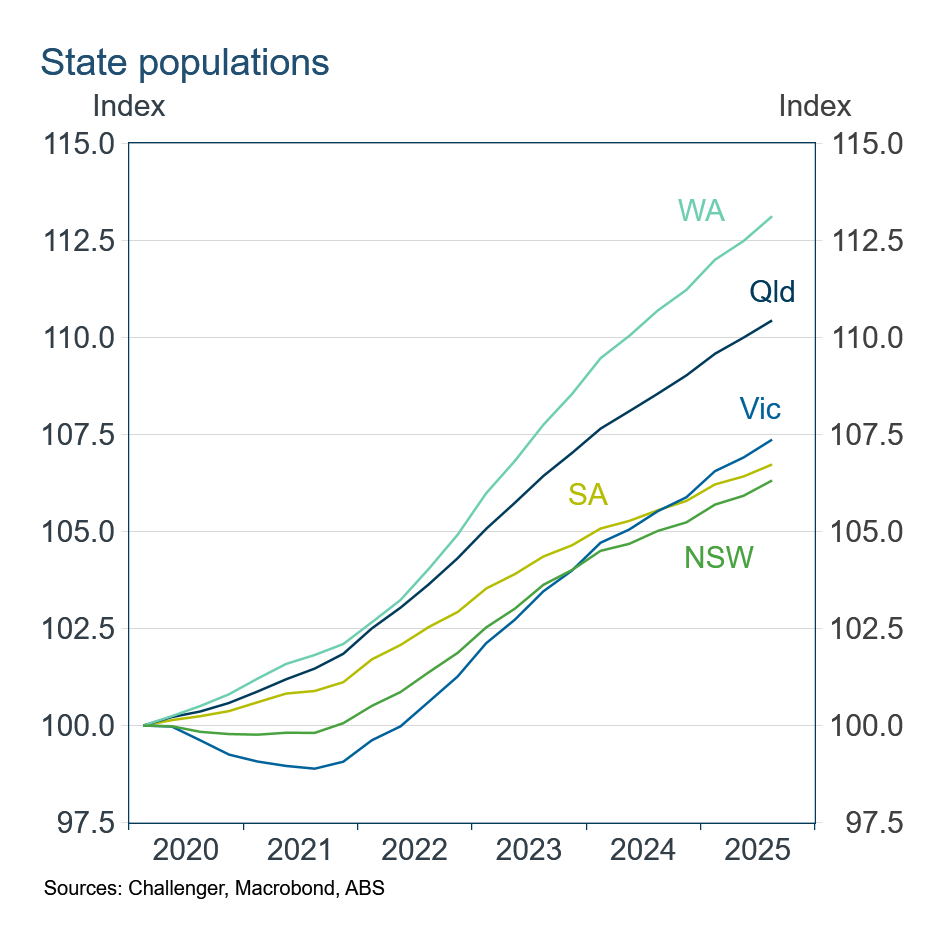
Stronger price growth in WA and Queensland partly reflects faster population growth, with populations 10–13% larger over the past five years. Population growth in the other states has been roughly half that in WA.
Rapid population growth does not necessarily translate into stronger price growth if the construction sector and the planning framework are sufficiently flexible to increase dwelling supply. Across the states dwelling stock growth has differed markedly. Victoria has led for several years, adding two new dwellings each year for every 100 existing dwellings. This stronger supply response has been an important factor in moderating price growth in Victoria.
Western Australia has increased the pace of new completions over the past 18 months, which should help moderate future price growth. In NSW, by contrast, new housing supply has unfortunately slowed significantly.
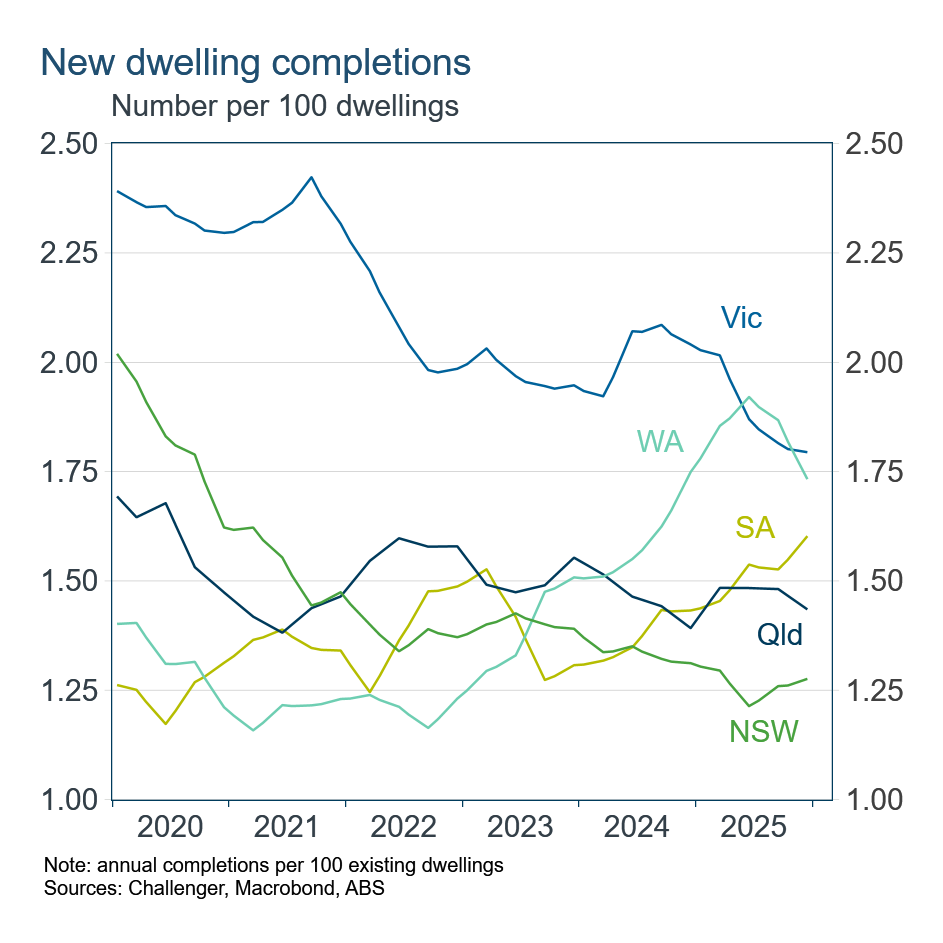
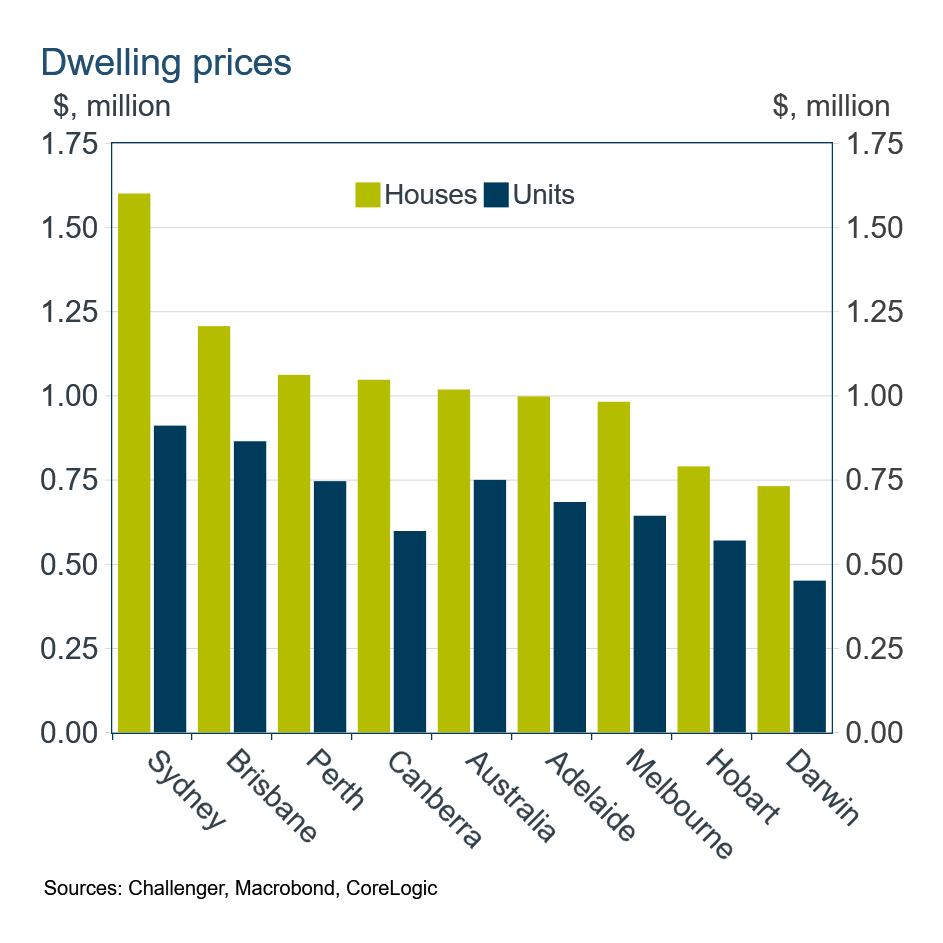
Despite weak dwelling stock growth – and population growth broadly similar to the other south-eastern states – NSW has recorded subdued price growth. Prices in NSW, and Sydney in particular, appear to have been constrained by level of prices far exceeding the rest of the country. At some point, high prices limit ongoing price growth.
Stronger supply growth in Victoria has seen Melbourne prices slip to being the lowest among the mainland capital cities, after historically being the second or third most expensive. A weaker Victorian economy has likely contributed, although that has not led to softer population growth.
Overall, this reinforces the importance of Federal and state governments’ efforts to increase housing supply. Increased supply and not measures that boost demand with grants or easier access to finance, is the only way to make housing more affordable on a sustainable basis.
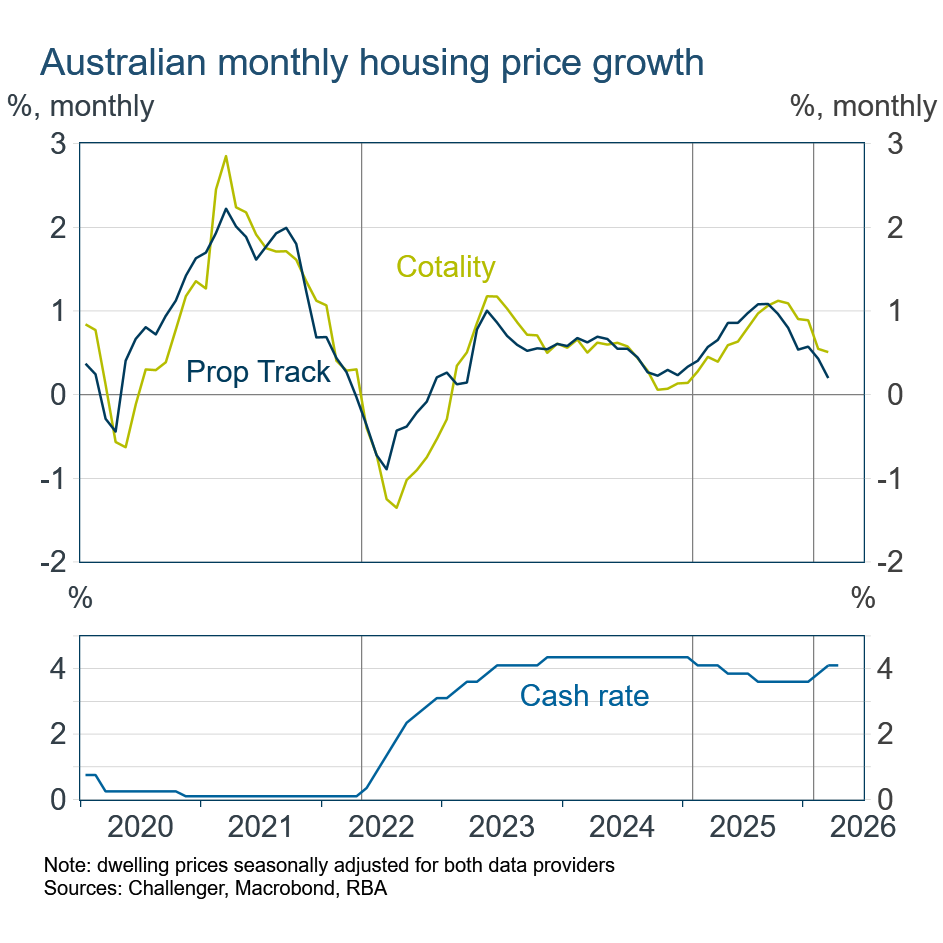
Interest rates have a clear cyclical effect on housing price growth, which is evident across different housing price indices. Price growth was very strong during the ultra-low interest rate settings of the pandemic period. When the cash rate peaked at 4.35%, housing price growth stabilised at around 0.5% per month before easing further. With the cash rate cuts in early 2025, housing price growth accelerated. Price growth began to slow from late last year as expectations of higher interest rates increased. With the cash rate set to increase further this year, housing price growth is likely to moderate further.
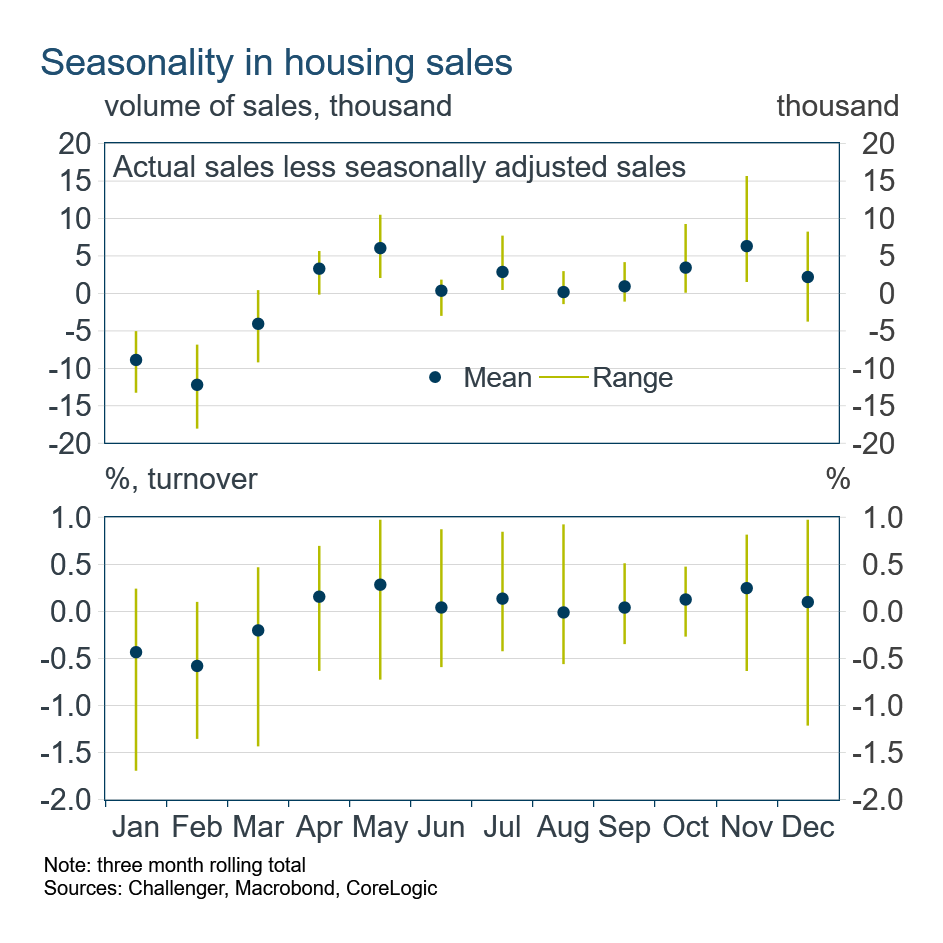
Housing price growth also exhibits strong seasonality through the year. Growth is stronger in spring and autumn, with monthly price growth around 0.1–0.2 percentage points higher than in adjacent months. By contrast, price growth in winter and summer is 0.1–0.2 percentage points lower than adjacent months.
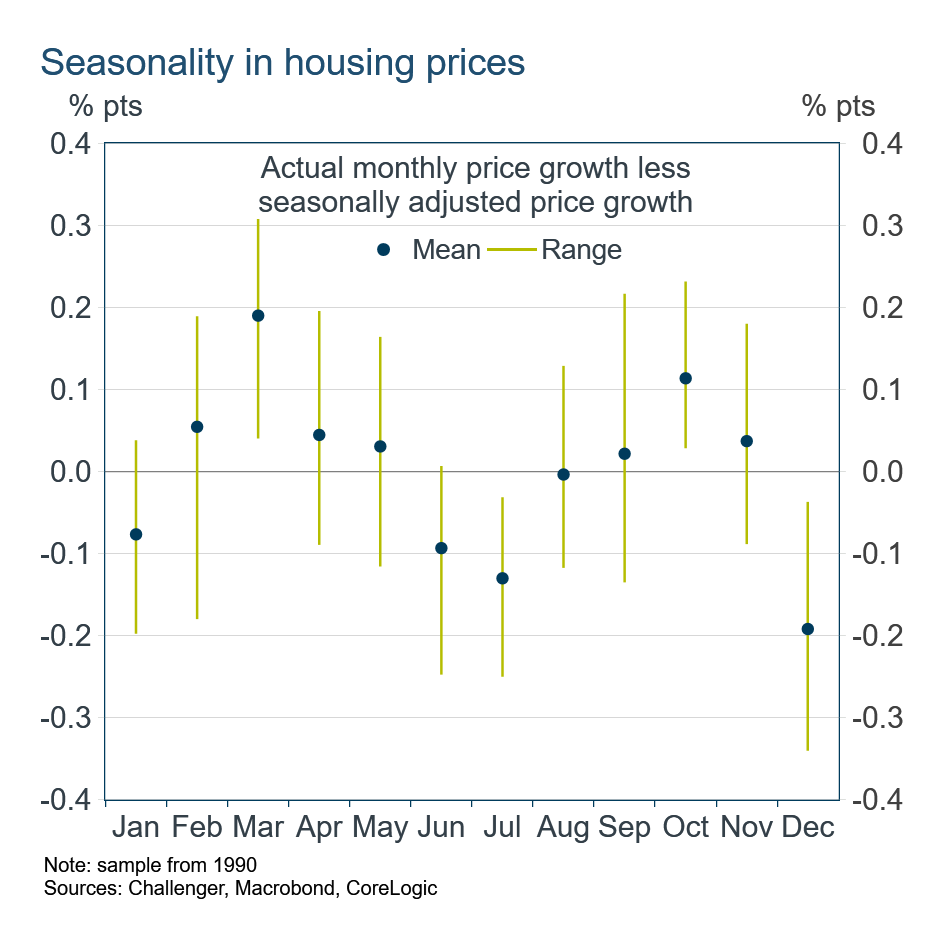
Purchasing at certain times of the year might save you a little, but the trade-off is fewer properties available to purchase. The number of housing sales is also significantly seasonal with more sales occurring in spring and autumn (shown below as a three-month rolling total). With higher interest rates and the winter slowdown, the housing market will soon be entering hibernation.