Examining the downgrade of Queensland's debt rating

Subscribe to Macro Musing
To stay up to date on the latest economic insights, subscribe to Macro Musing on LinkedIn.
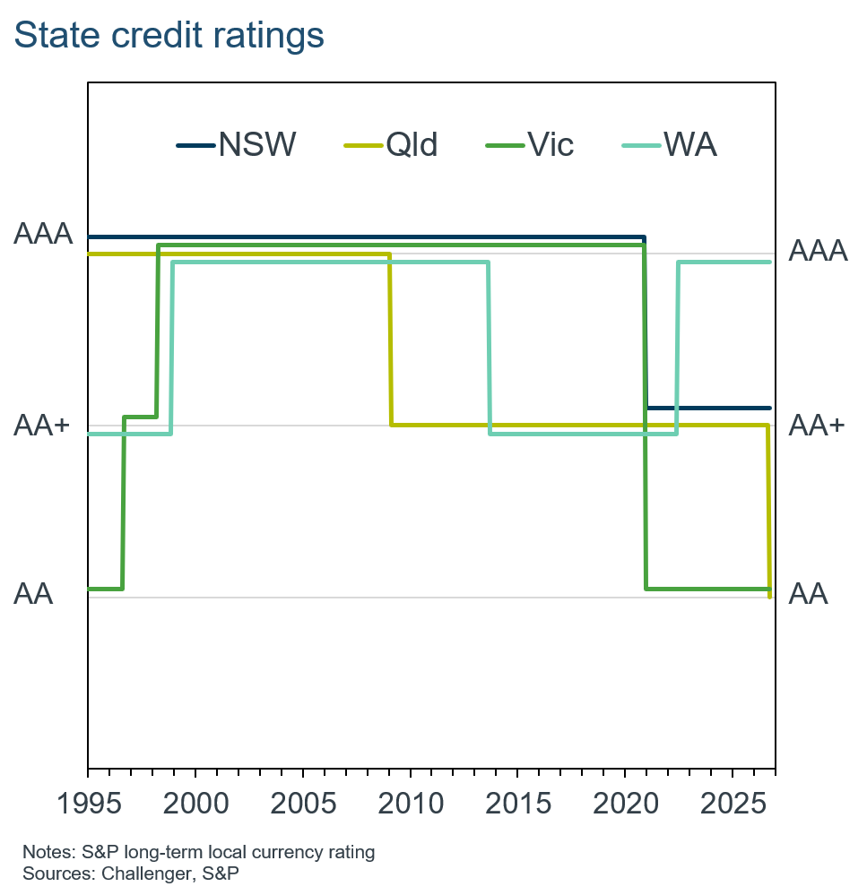
S&P downgraded Queensland’s debt rating from AA+ to AA, while affirming NSW’s rating at AA+. Both states had been on a negative outlook, signalling the possibility of a downgrade. Queensland now joins Victoria at AA, after Victoria was downgraded during the pandemic. Throughout this time the Australian Government had a AAA local currency credit rating and so the sovereign rating was not a constraint on the state ratings (the Australian Government rating was AA+ but only for foreign currency debt from 1999 to 2003 by S&P).
Why has Queensland been downgraded while NSW was not, and does it really matter?
Queensland’s downgrade to AA, while NSW remained at AA+, came despite NSW net debt being twice as large relative to Gross State Product: 13% compared with 6%. The difference in gross debt is less stark, at 20% for NSW and 17% for Queensland.
However, credit ratings are intended to be forward-looking, and the outlook for Queensland’s finances is not good. Queensland’s own projections show gross debt increasing sharply over the coming years, with its debt ratio exceeding that of NSW within two to three years.
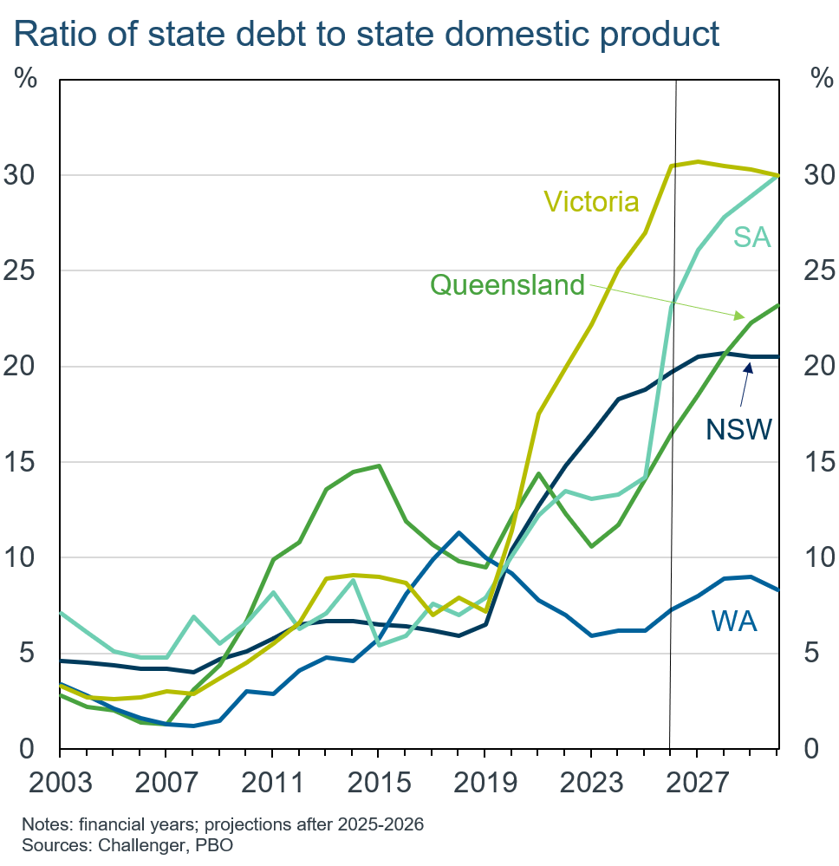
Debt is growing in Queensland because expenditure has increased sharply in recent years, outpacing a modest rise in government revenue. By contrast, NSW expenditure has increased broadly in line with revenue. Both are projected to decline gradually over the next few years, leaving the state’s debt ratio broadly unchanged.
S&P also pointed to substantial infrastructure spending for the Brisbane Olympic and Paralympic Games, which will keep the state’s cash deficit larger than is consistent with an AA+ rating.
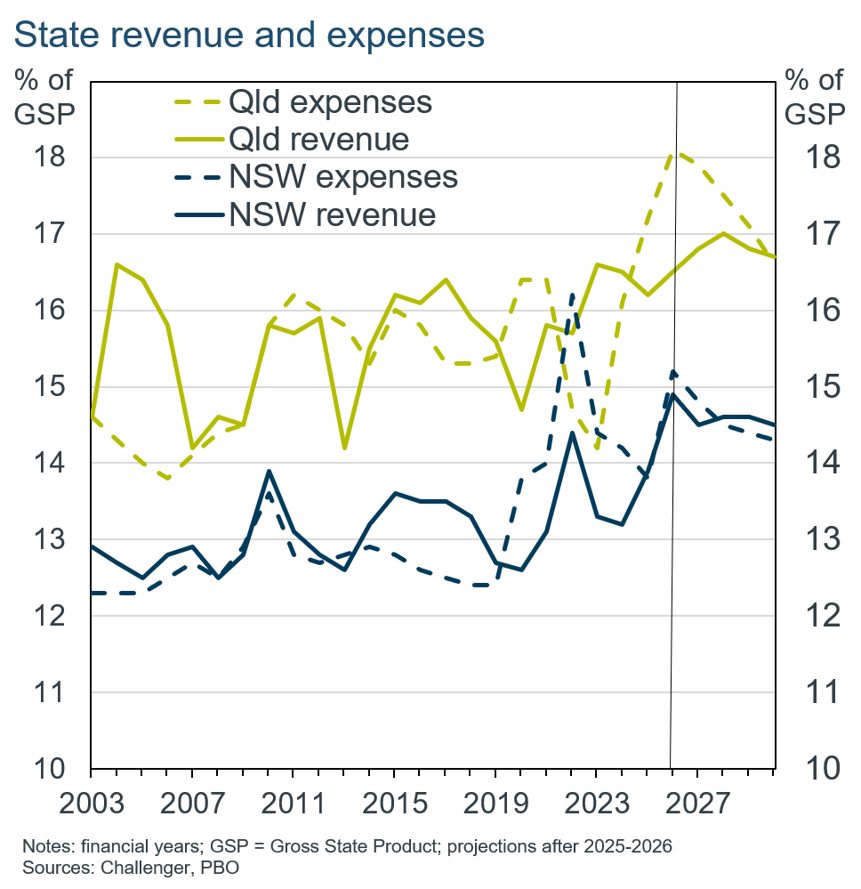
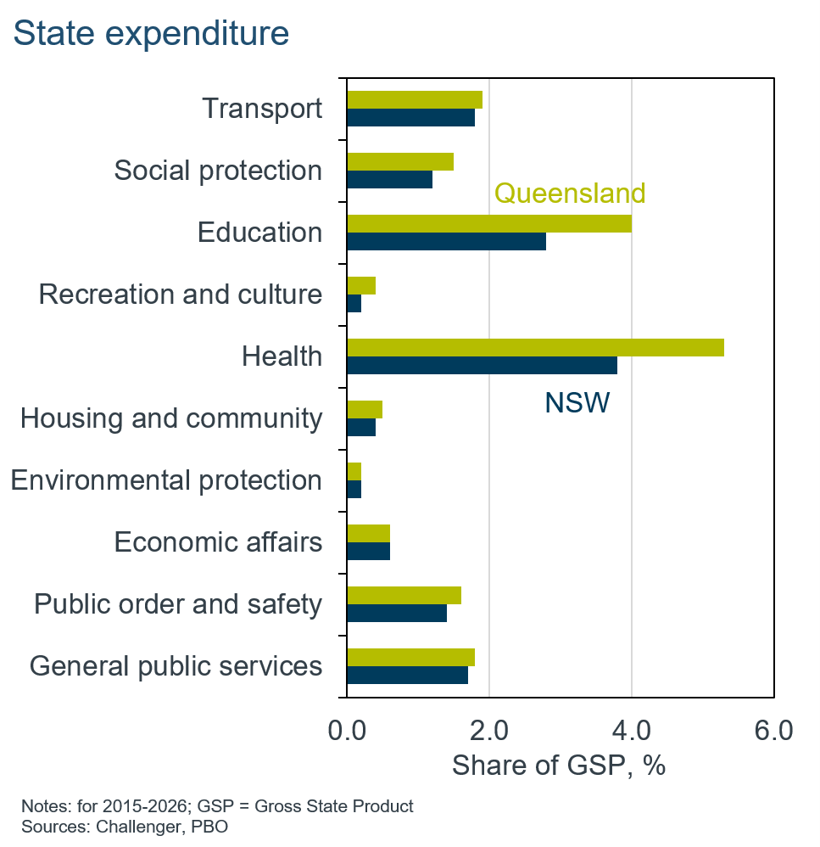
Government expenditure growth in Queensland has been broad-based. S&P highlighted 10% growth in operating expenses in each of the past three years. Spending on education and health, two categories that are politically difficult to cut, is substantially higher in Queensland than in NSW. This partly reflects Queensland’s more dispersed population and the Australian Government’s contribution to funding these services.
While AA remains a strong credit rating, the downgrade will raise Queensland’s borrowing costs. But it is important to keep that additional cost in perspective.
Yields on 5-year state debt, a useful proxy for borrowing costs because the tenor is close to the average maturity of state debt, have increased from 1% in late 2021 to close to 5.5% today. States stagger their debt issuance, so it will take time for the rise in interest rates to be fully reflected in their average funding costs.
Against this large move in market interest rates, state bond yields sit almost on top of one another. The differences are very small despite the variation in credit ratings.
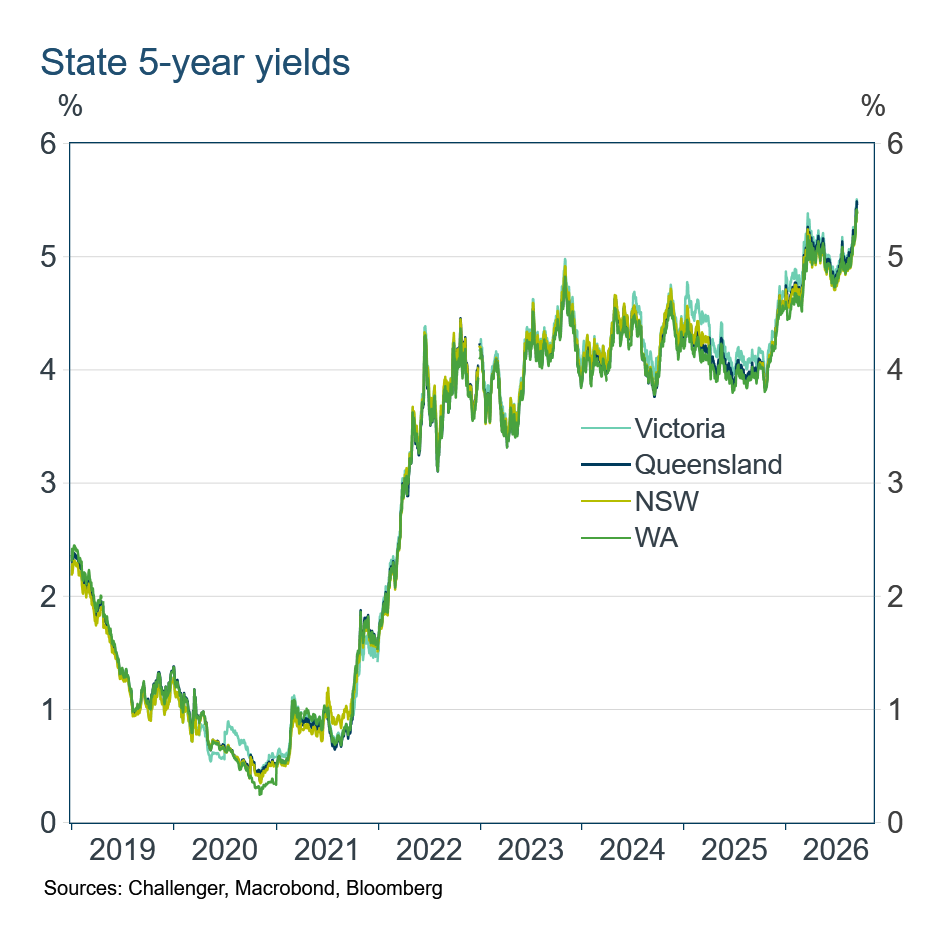
Queensland had been on negative outlook since early 2025, giving financial markets time to anticipate a downgrade and price the state’s debt accordingly. As a result, the market response to the announcement was small.
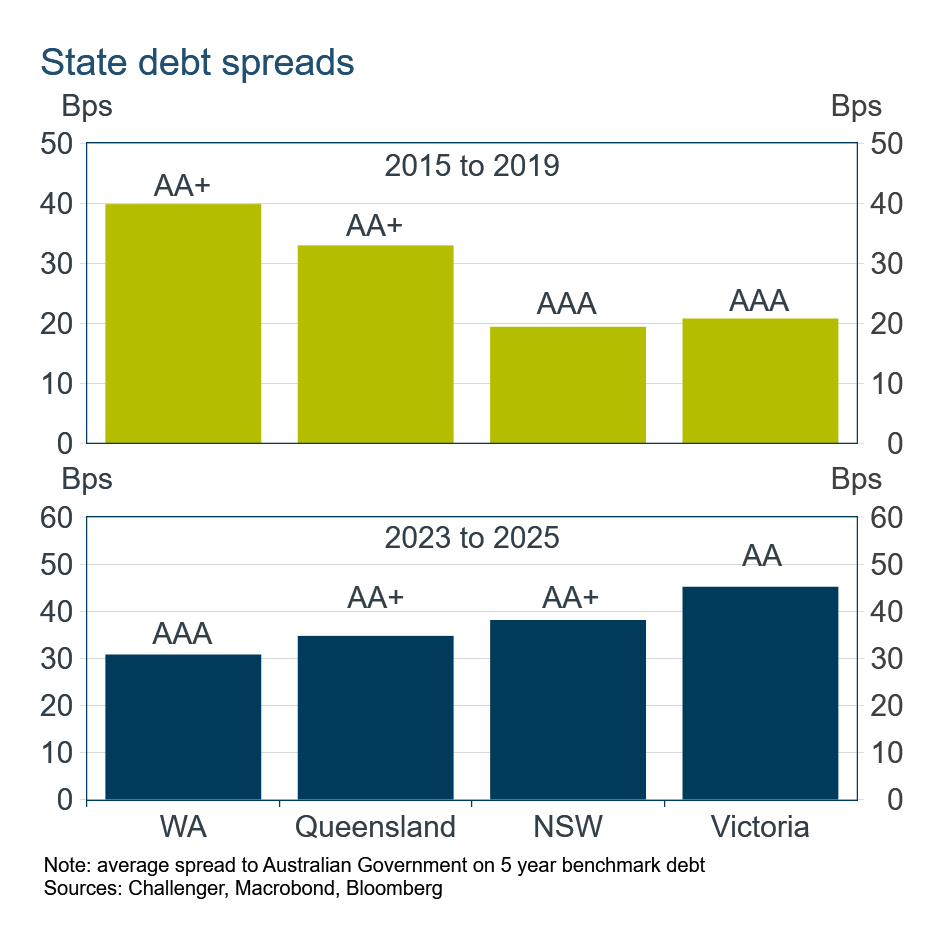
We can gauge the relationship between credit ratings and borrowing costs by comparing spreads between state and Australian Government bond yields over periods without rating changes. From 2015 to 2019, AA+ rated WA and Queensland paid 10 to 20 basis points more on 5-year debt than AAA-rated NSW and Victoria. More recently, from 2023 to 2025, the ratings had flipped: AAA-rated WA paid 5 to 10 basis points less than AA+ rated Queensland and NSW, which in turn paid around 10 basis points less than AA-rated Victoria.
Lower-rated states do pay more to borrow, and the spread can vary with the market’s risk appetite. But it is small compared with the shifts in interest rates over time.
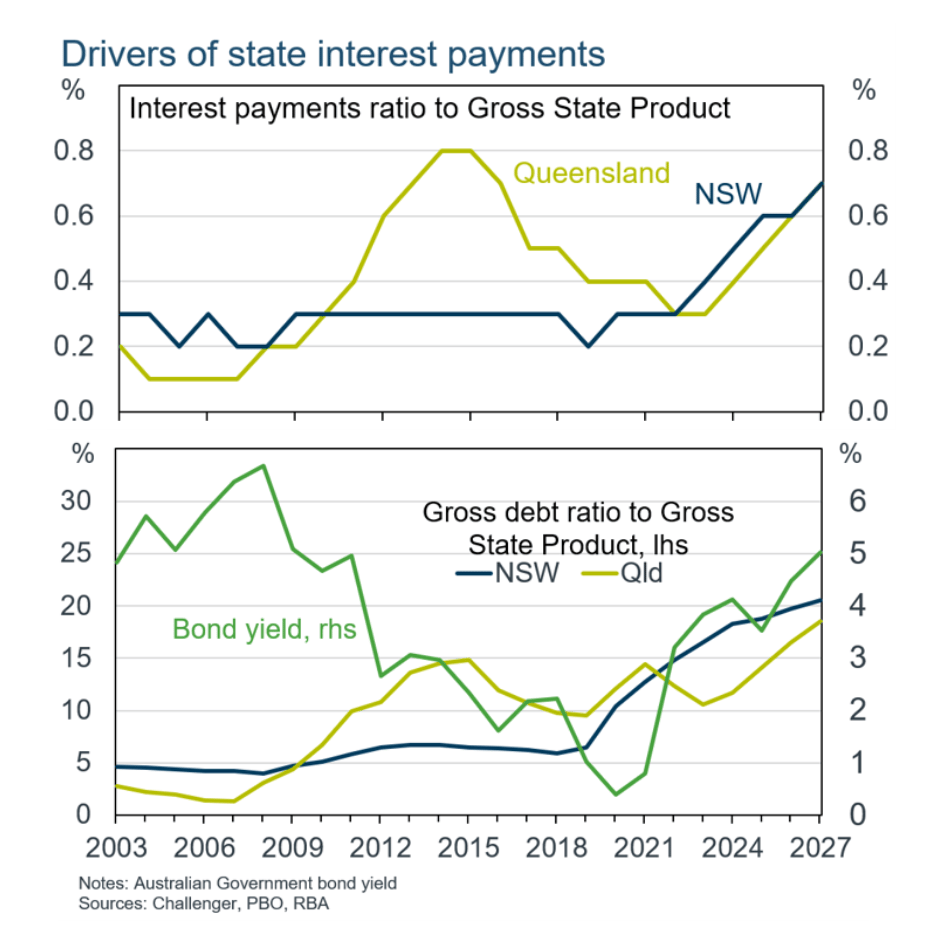
A state’s total funding cost depends on both the size of its debt and the interest rate paid on it. Queensland’s debt ratio increased from 2012 to 2017 to well above that of NSW. At the time, however, low bond yields cushioned the cost of carrying that higher debt.
Since the pandemic, debt levels and interest rates have both risen, pushing interest payments to a larger share of state output and government expenditure. States are now confronting the reality of higher debt stocks and higher yields. The effects are significant, with interest payments in NSW and Queensland more than doubling since the pandemic.
The very low yields before and during the pandemic increasingly look like the aberration. With governments worldwide running fiscal deficits, defence spending increasing and AI-related investment surging, interest rates are likely to remain above pre-pandemic levels.
For the total cost of state debt, the large rise in yields and the increase in debt stocks dwarf the additional 10 or even 20 basis points associated with a downgrade.
NSW debt has more than doubled since before the pandemic to around $180b. At an average interest rate of 5%, annual interest payments on that additional debt would be around $4.5b. A 2 percentage point rise in the average yield would eventually increase annual debt-servicing costs by around $3.6b. By contrast, a 10 basis point increase in borrowing costs following a downgrade would add only around $0.2b.
A credit downgrade matters less for the small increase in borrowing costs than for its warning of a rising debt stock that carries a much larger funding burden.