.png?h=800&iar=0&w=1200)
Express yourself: the tension in wage growth and inflation

Subscribe to Macro Musing
To stay up to date on the latest economic insights, subscribe to Macro Musing on LinkedIn.
Inflation in May was a touch softer than expected, with seasonally adjusted prices falling 0.1%, bringing year-ended inflation down to 4.0%. Given recent falls in fuel prices, the latest peak of inflation will have been 4.6% in March, absent a resurgence of the Middle East war.
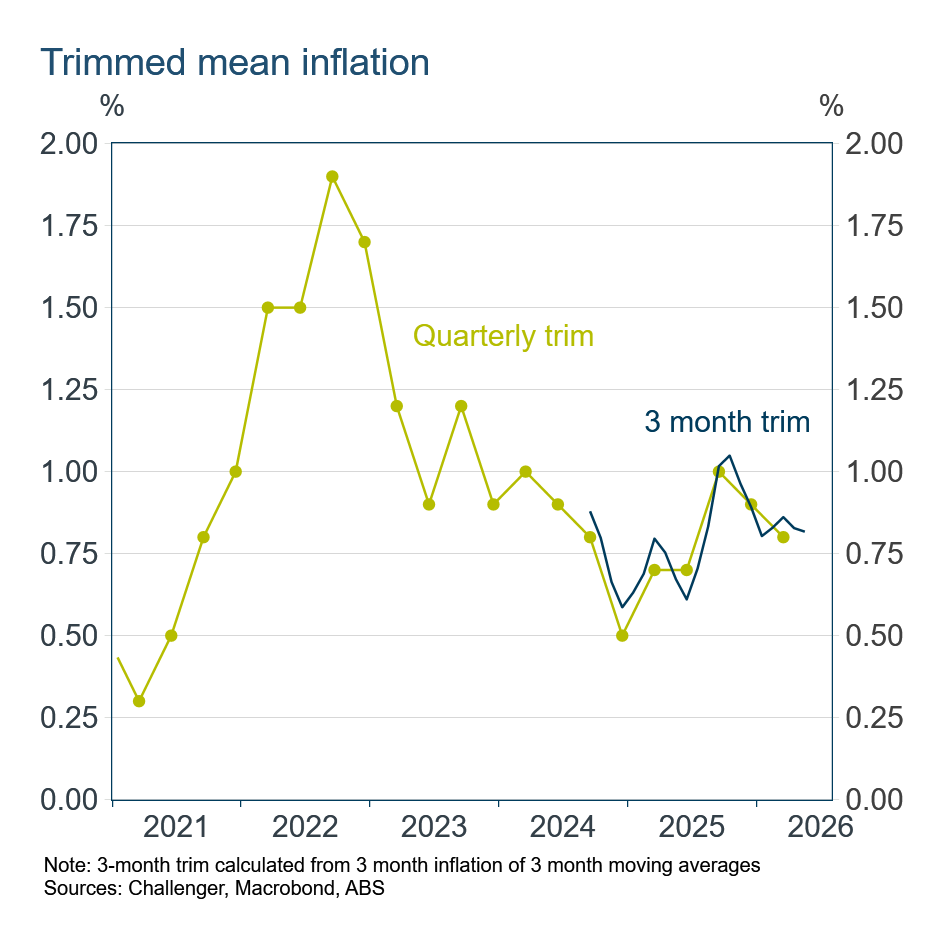
The three-month trimmed mean was 0.82% for the three months to May. This inflation measure will be a focus for the RBA because unlike the published noisy monthly trimmed mean it behaves akin to the trusted old quarterly trimmed mean. While the three-month trimmed mean has slowed from rates around 1% at the end of 2025, this year it has been stuck around 0.8%. That’s too high for the RBA to be comfortable.
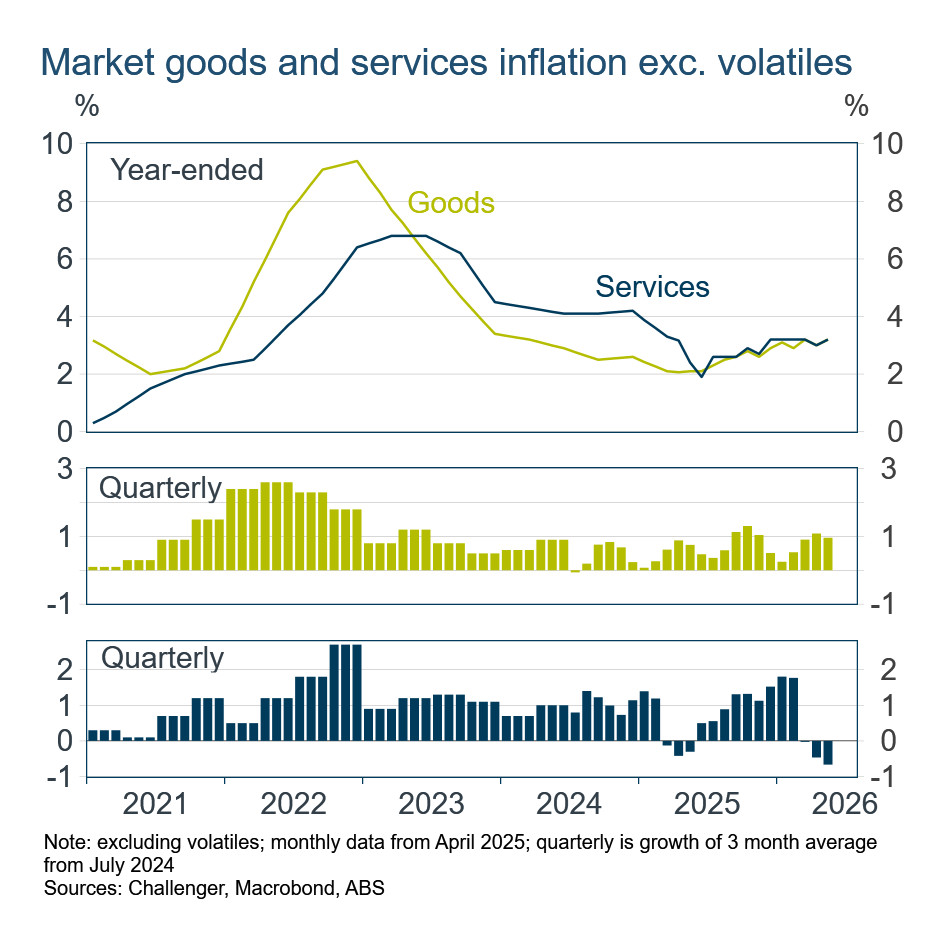
Some positive news was that inflation in the important market services categories slowed, with the three-month rate edging lower to –0.7%. This provides some alternative evidence that domestically generated inflation is easing, although the slowdown has been concentrated in international travel, and to a lesser extent, domestic travel. Reduced travel demand reflects high travel prices and more general cost-of-living constraints, demonstrating that high inflation is curtailing spending.
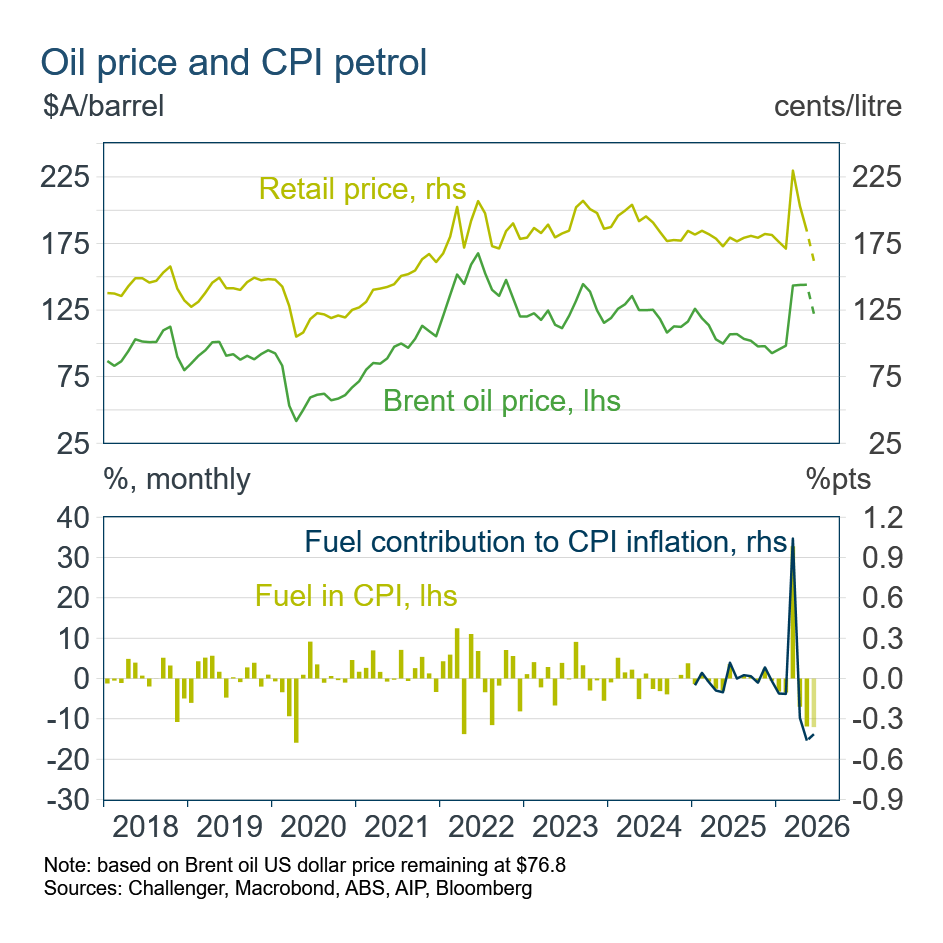
Falling fuel prices were a big contributor to the slower inflation accounting for much of the 0.7% fall in non-seasonally adjusted prices in the month. However, fuel’s 7.7% increase over the year is still making a significant contribution to annual inflation.
The fall in fuel prices in June will see fuel make a further subtraction from inflation, around the same magnitude as in May. However, with the reduction in fuel excise being halved in July and the original fuel excise rate restored in August, fuel costs will add to inflation in those months unless oil prices fall further.
Some of the second-round effects of higher fuel prices from higher transport and material costs are beginning to appear. Prices for the construction of new housing increased 0.9% in the month as the oil price contributes to higher material costs including through transport costs. Over the year, new dwelling prices are up 5.6%, given higher labour costs, adding to the challenge of delivering affordable new housing. The tight housing market contributed to rents increasing 3.6% over the year.
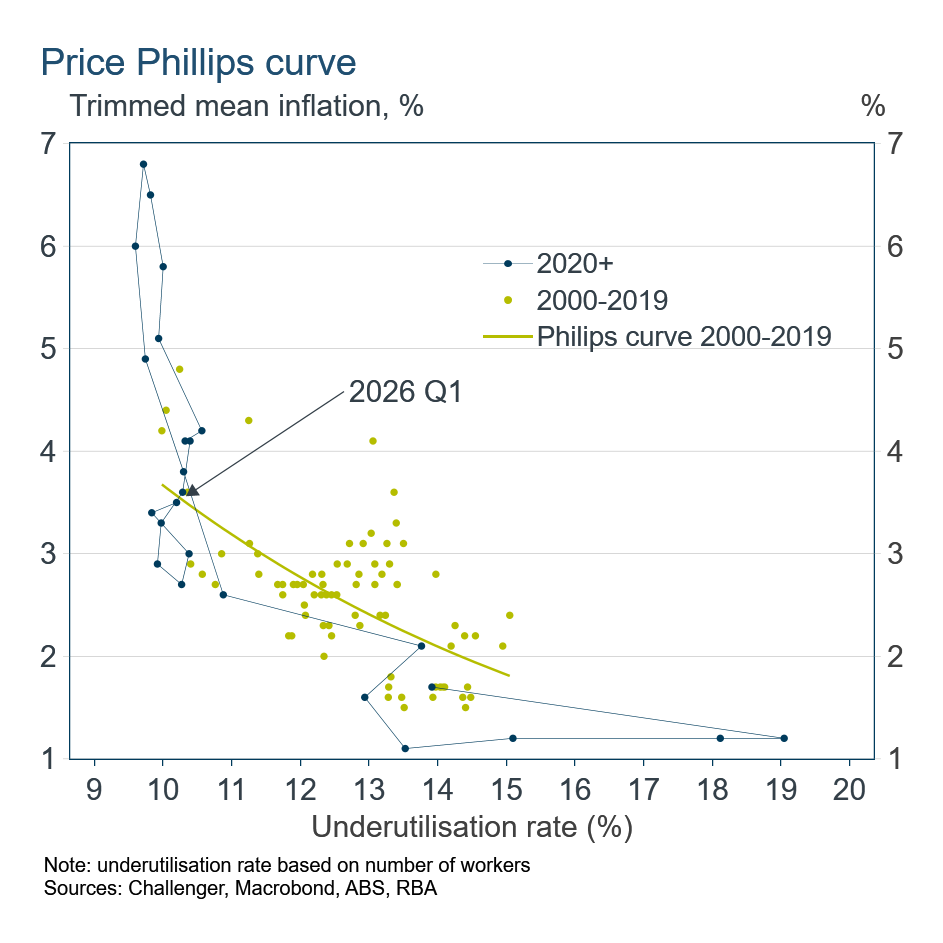
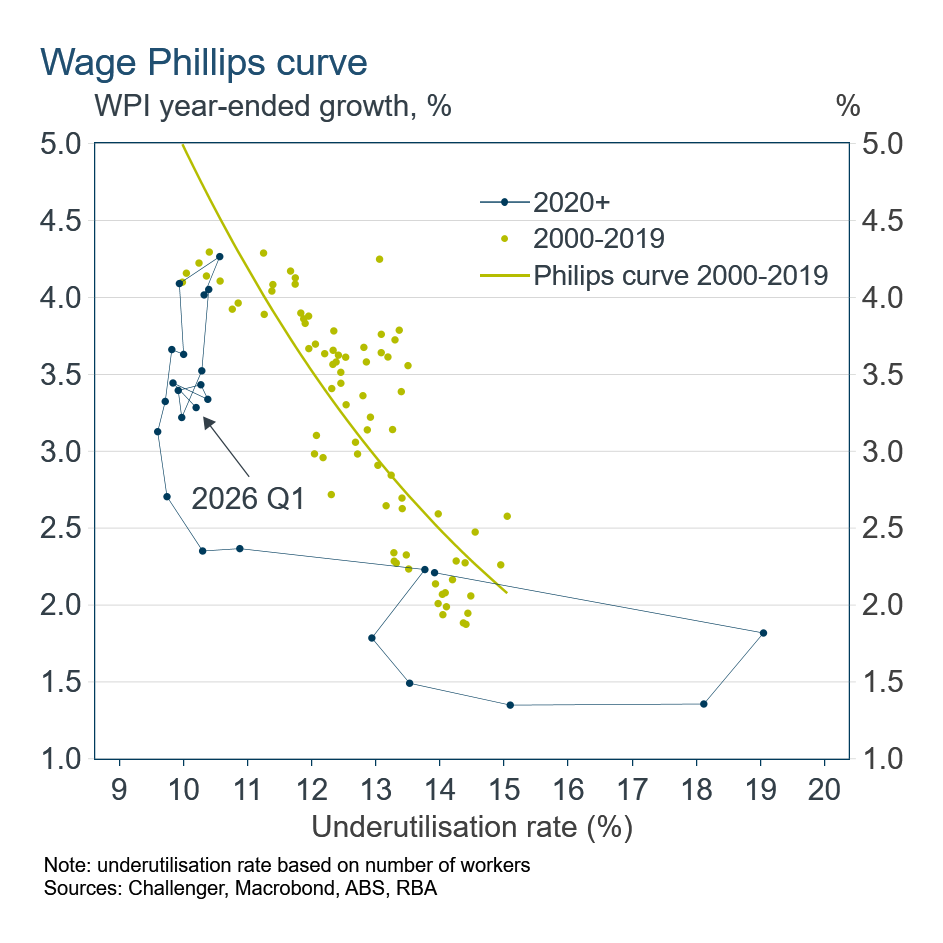
With inflation central to the RBA’s deliberations for a further hike at its August meeting, it is worth delving into the dynamics of price pressures. The Phillips curve relationship between inflation and the labour market is a key framework the RBA will lean on. The pandemic shock to the labour market and the post-pandemic inflation surge disrupted the usually reliable relationship between inflation and labour underutilisation, which captures unemployment and those who want to work more hours. But as those shocks fade, we can expect the old relationship to reassert itself as a tight labour market results in higher inflation.
The historical relationship suggests the current underutilisation rate of 10% is too low for trimmed mean inflation to slow to a rate consistent with the RBA’s target.
Looking more directly at the relationship between wages growth, which drives inflation, and the labour market shows that wage growth is slower than would be suggested by the current underutilisation rate and the historical relationship. That highlights the risk that wages growth could pick up, entrenching above-target inflation.
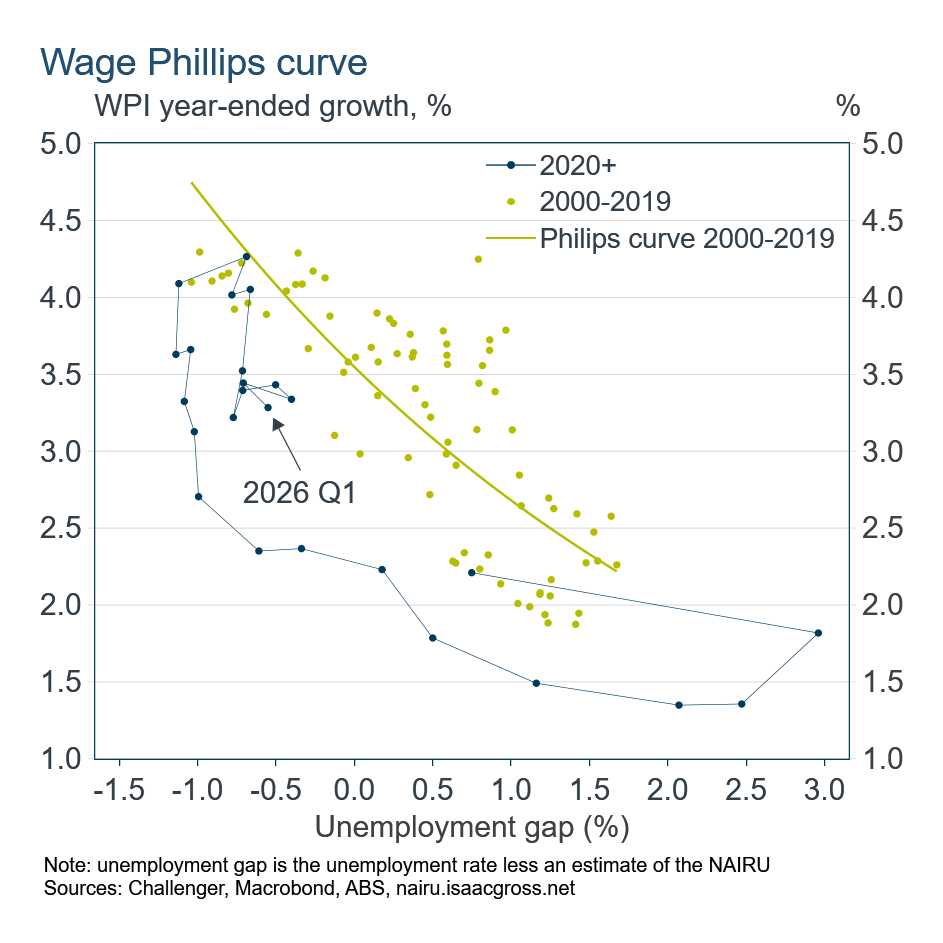
However, labour market conditions that deliver stable inflation can change. That is, the ‘NAIRU’ varies through time (NAIRU = non-accelerating inflation rate of unemployment). The NAIRU can change in response to labour market laws and practices, as well as recent labour market conditions affecting the employability of workers given their skills and experience.
The wage Phillips curve using the unemployment gap between the unemployment rate and the estimated NAIRU also highlights the risk of increased wage inflation given the tightness of the labour market. However, it is possible that given job uncertainty given the rise of AI will see weaker wages growth than the historical relationship implies.
The RBA is forecasting an increase in the unemployment rate to 4.7%, which is close to estimates of the NAIRU. However, given the NAIRU is estimated and not observed, there is significant uncertainty around its level. That leaves the RBA finely balanced, watching how wages and inflation respond to the labour market to determine its next move.
Related content
Stay informed
Sign up to our free monthly adviser newsletter, Tech news containing the latest technical articles, economic updates, retirement insights, product news and events.