Productivity in mining and other industries

Subscribe to Macro Musing
To stay up to date on the latest economic insights, subscribe to Macro Musing on LinkedIn.
The National Accounts release last week reported another weak productivity outcome. Productivity fell by 0.6% in the first quarter, leaving average annual growth since 2018 at just 0.1%.
Industry-level data on output and hours worked provide a clearer sense of what lies behind Australia’s productivity malaise.
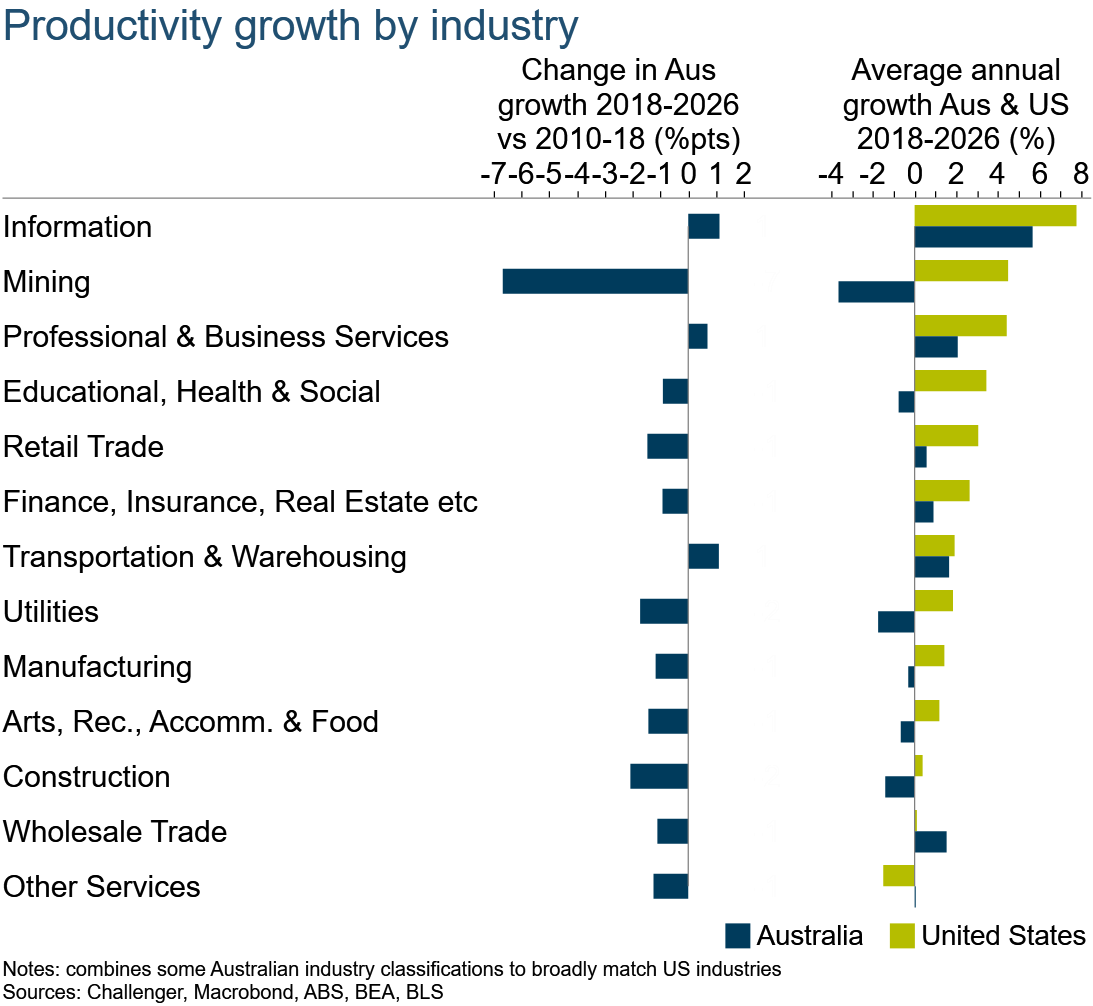
Productivity growth in the current cycle, from 2018 to now, has been lower than in the 2010 to 2018 cycle in almost every industry (the first column in the chart below). Only three industries – information, professional & business services, and transportation & warehousing – experienced an increase in productivity growth. The most recent period includes the Covid pandemic, but taking an average across the cycle abstracts from the distortion to measured productivity during and after the pandemic. The slowdown is real.
Over the past eight years, productivity growth has been weaker in Australia than in the United States in almost every industry (second column below). This is not simply a story about the larger size of the US information technology sector. The US outperformance has been broad-based.
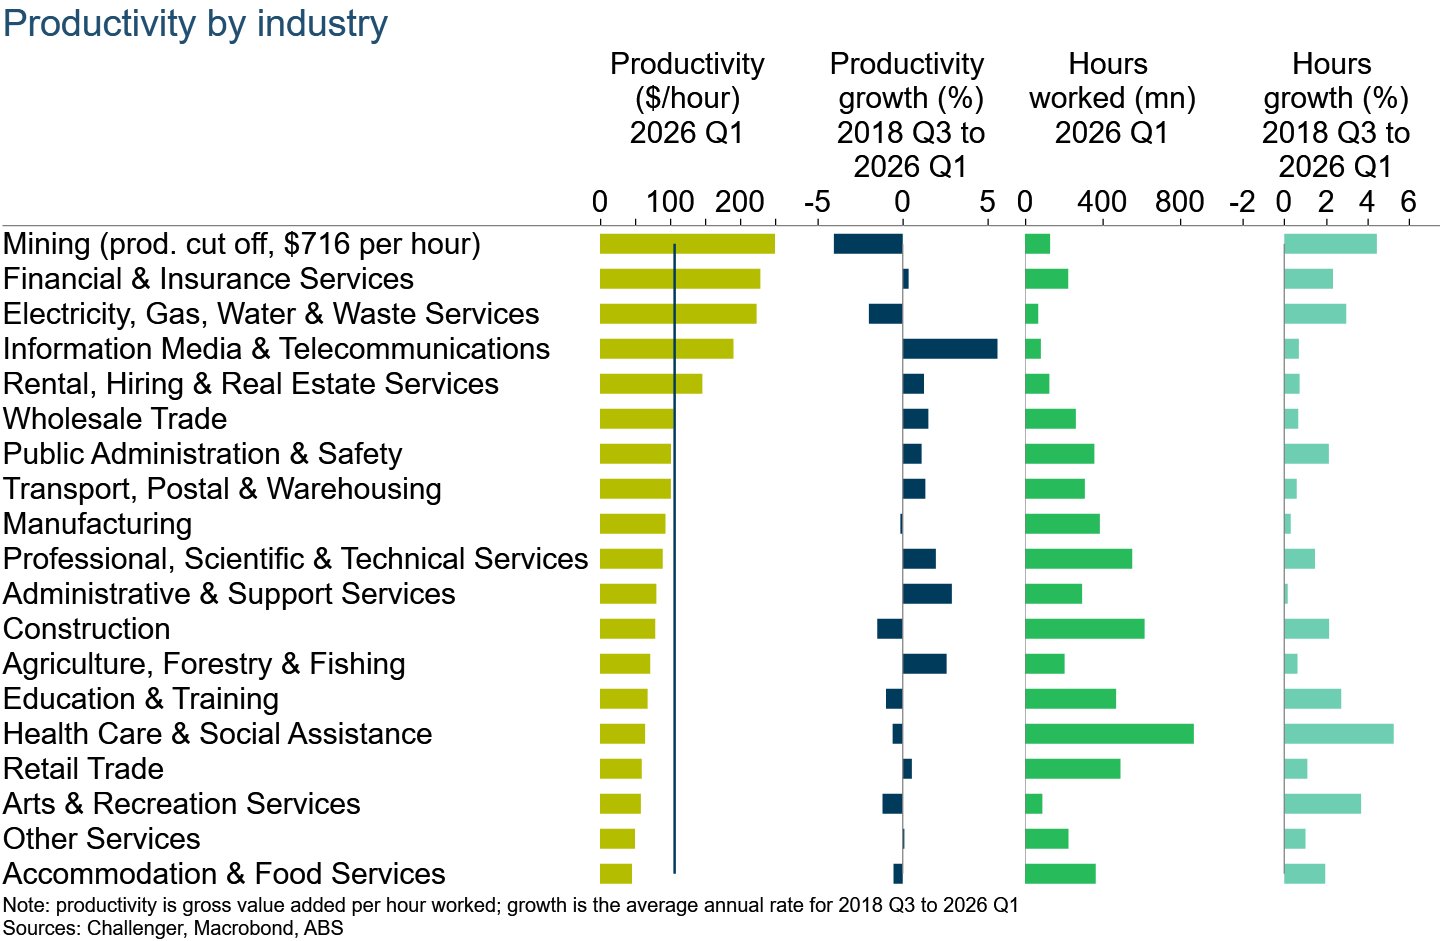
Mining has a much higher level of productivity than other industries in Australia. Productivity is also relatively high in finance, utilities, media, and rental and real estate industries.
The largest industries by hours worked are health care, construction, professional and technical services, retail trade, and education and training. These industries have below-average productivity levels and many have also seen strong growth in hours worked.
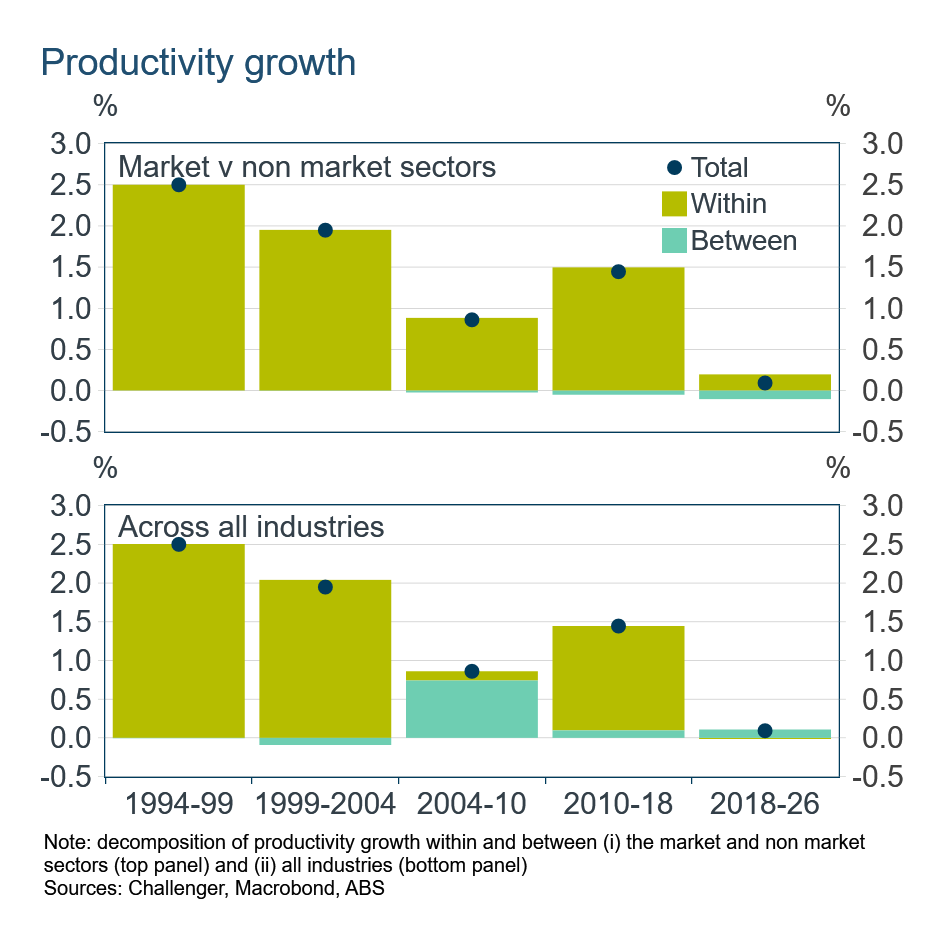
A common explanation for Australia's weak productivity is the expansion of government-dominated, ‘non-market’, industries: health care, education, and public administration. However, the data provide little support for that view. Decomposing economy-wide productivity growth into within-sector growth and shifts in employment between the market and non-market sectors shows that the rise in non-market employment has made only a very small subtraction from aggregate productivity growth. Almost all of the slowdown reflects weak productivity growth within the two sectors.
The industry-level decomposition tells a similar story. There has been no growth in aggregate productivity from within industries. Indeed, the movement of workers across industries actually made a small positive contribution to productivity growth in the most recent period. Employment has grown strongly in the care economy, but it has also grown strongly in higher-productivity industries such as mining, finance, and utilities. Note, the sizeable boost to aggregate productivity from changes in industry composition in 2004 to 2010 came from increased employment in mining.
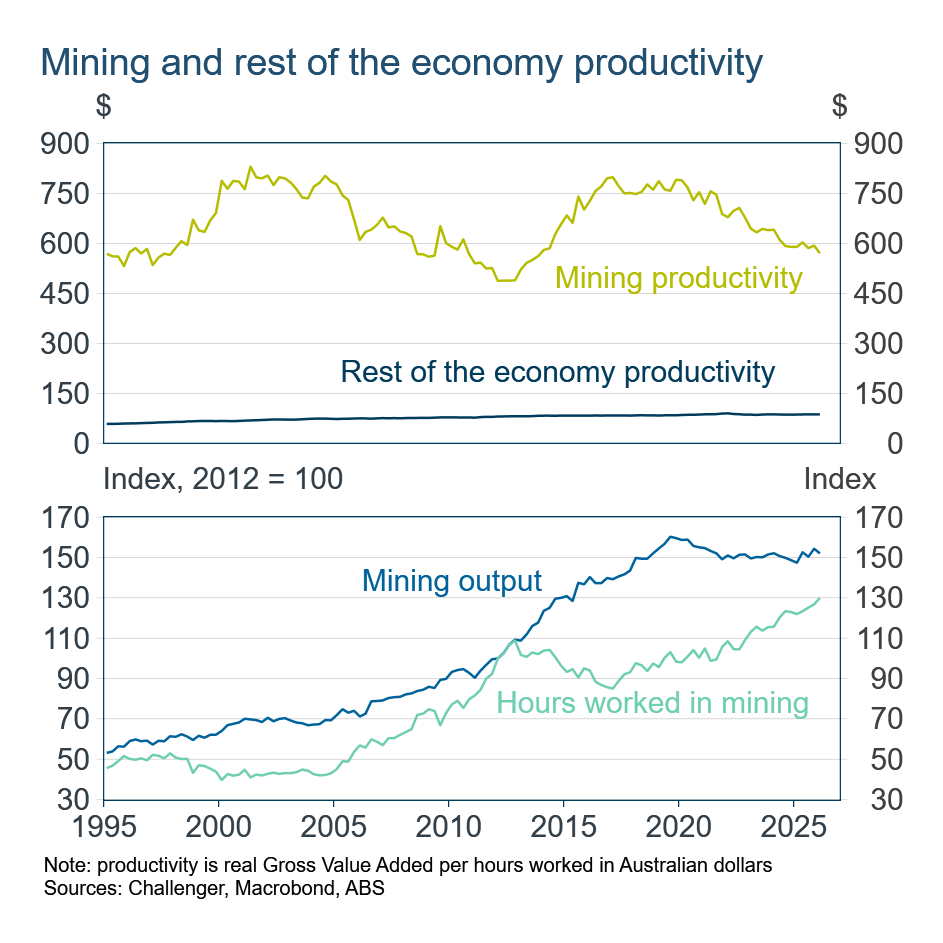
Mining productivity has had large cycles over the past 30 years, but on net it has shown no growth. Because mining is highly capital intensive, its level of productivity is far above that of the rest of the economy, currently around $600 an hour compared with about $85 an hour in the rest of the economy.
For economy-wide productivity, changes in mining’s employment and output shares matter more than the industry’s productivity swings themselves, because mining starts from such a high productivity level.
The large cycles in mining productivity reflect the mining boom: strong growth in employment from 2005 to 2012 as investment increased, followed by a ramp-up in production from 2012 to 2020 as that investment paid off. Productivity growth in that period was also supported by increased output of iron ore and LNG, both of which are capital intensive. Since 2020, productivity has been weaker because of higher maintenance spending, especially at older mines, and because of the pandemic and other disruptions.
As mining production ramped up after the investment boom, mining’s share of Australian output rose from around 11% in 2011 to more than 15% in 2020. That increase in mining output boosted economy-wide productivity relative to a measure excluding mining.
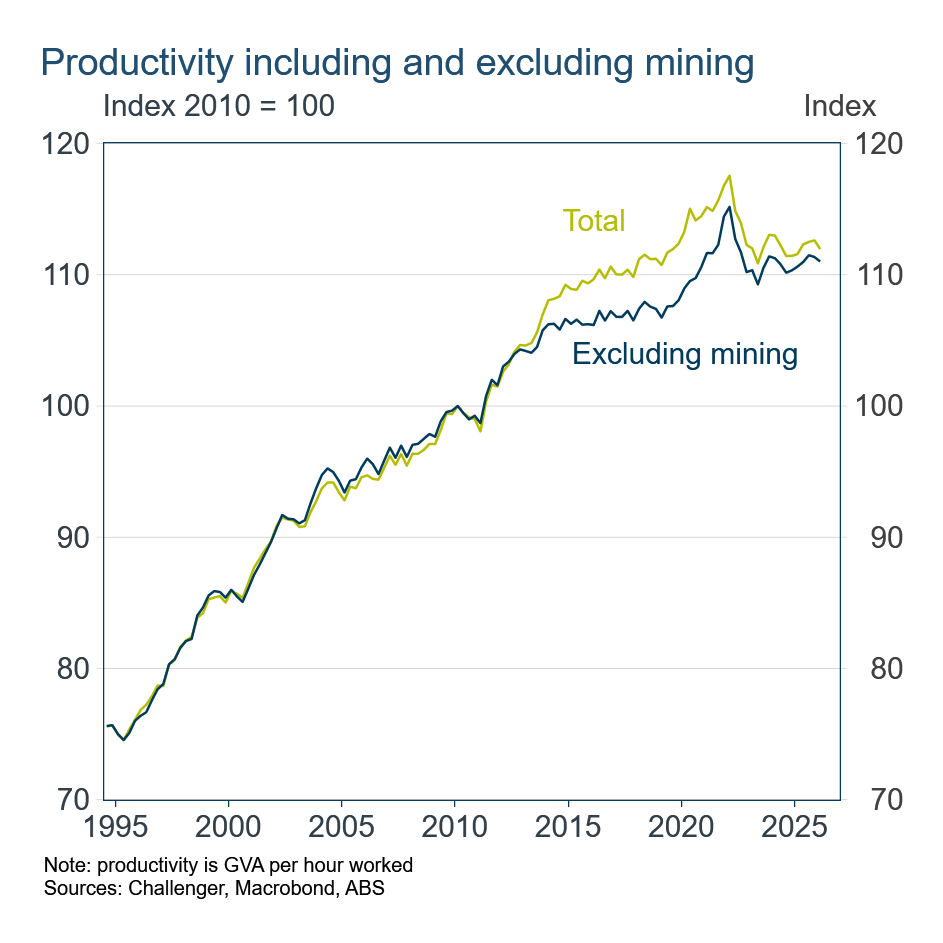
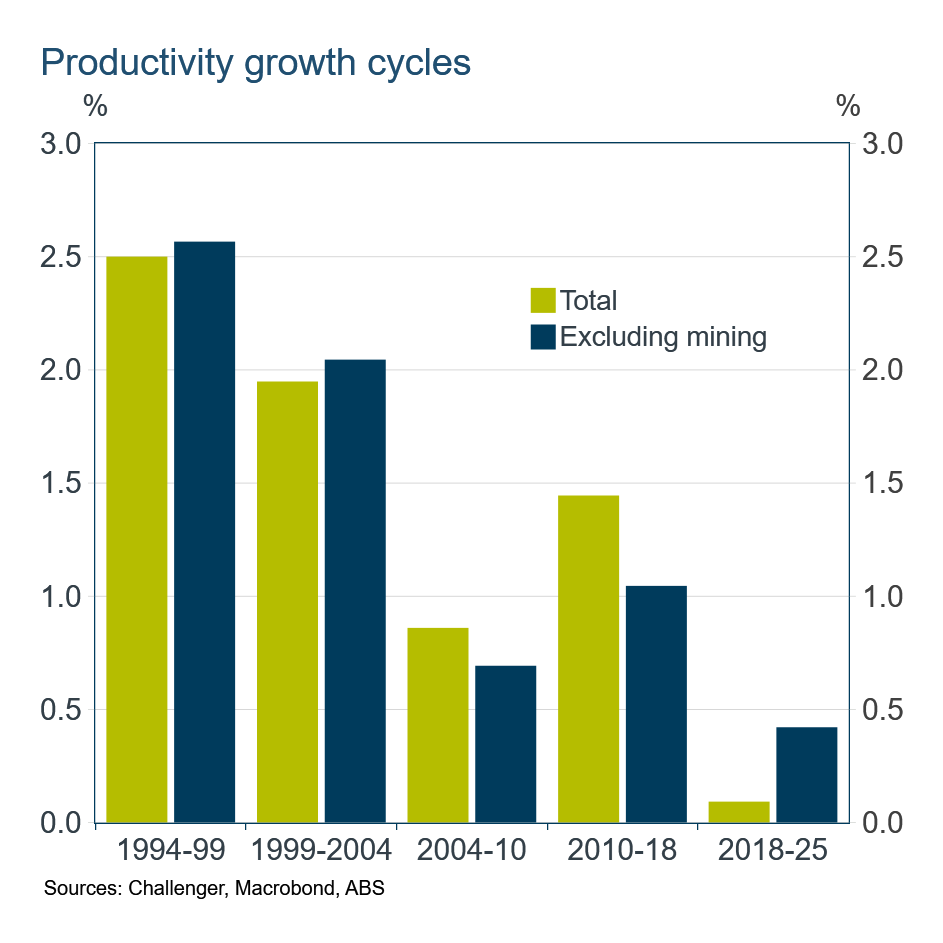
Some commentators have suggested that Australia’s weak productivity growth is really a mining story. It is true that mining has been a drag since 2020, through both a lower share of output and weaker productivity. But even excluding mining, productivity growth in the current cycle has still been weaker than in the preceding one.
All up there’s no disputing Australia’s productivity performance over the past eight years has been anaemic, and that has weighed on living standards. The care economy is not the culprit. Nor is mining.
Weak productivity growth across almost all industries suggests the problem is economy-wide rather than sector-specific. As Danielle Wood, chair of the Productivity Commission, recently noted, regulation has accumulated over time and can impede business efficiency. Unshackling businesses by reducing regulation will enable them to be more efficient, driving productivity growth. Reducing unnecessary regulation – while preserving the important welfare and environmental goals of regulation – is critical to improving Australian living standards.
Related content
Stay informed
Sign up to our free monthly adviser newsletter, Tech news containing the latest technical articles, economic updates, retirement insights, product news and events.