The RBA has another inflation problem

Subscribe to Macro Musing
To stay up to date on the latest economic insights, subscribe to Macro Musing on LinkedIn.
The RBA has two inflation problems. The first is well publicised, that inflation is too high. Given the growing strength of demand, and weak productivity growth, taming inflation will be difficult. Fortunately, the second inflation problem, how to interpret the new monthly CPI, is easier to address.
In November, the ABS began publishing inflation each month, previously inflation was only published quarterly. Having monthly inflation provides the RBA with more timely information to assess inflationary pressures and determine the appropriate policy to return inflation to its 2.5% target. However, interpreting the new monthly inflation data has not been straightforward.
- Year-ended inflation for the new monthly CPI has been higher than inflation for the old quarterly series since the middle of this year (Figure 1).
- Even more challenging for the RBA is that year-ended trimmed mean inflation has been consistently higher for the new monthly CPI data than it has been for the old quarterly CPI data (Figure 2).

The RBA targets CPI inflation but focuses on trimmed mean inflation as it is less volatile and a better indicator of demand pressures. The 30% trimmed mean, which is the RBA's focus, is calculated from the central part of the distribution of inflation rates of components of the CPI basket excluding the 15% of largest and 15% of smallest price changes.
The challenge for the RBA is that with the new monthly trimmed mean inflation rate higher than the old quarterly trimmed mean, but only a short history of the monthly trimmed mean available, it is difficult to interpret whether inflationary pressures are indeed stronger, or this is just a quirk in the new monthly data.
The technical bit
Since the RBA began targeting inflation in 1993 both CPI inflation and trimmed mean inflation have averaged 2.66%, a little above its 2.5% target. With no average difference between CPI inflation and trimmed mean inflation, trimmed mean inflation can be used as an unbiased, but importantly less volatile, indicator of inflationary pressures.
The monthly trimmed mean may have an upward bias relative to quarterly trimmed mean inflation if the distribution of the 87 components (expenditure classes) used to calculate inflation is systematically asymmetric, that is it is skewed. The limited 18-month history of monthly inflation data has on average had a negative skew (Appendix Figure 4). A negative-skewed distribution will tend to result in the trimmed mean being higher than the standard inflation rate calculated with the full distribution. The skewness coefficient is a useful, but not perfect, indicator of the potential bias in the trimmed mean as the skew captures the shape of the entire distribution whereas it is the shape of the distribution in the trimmed tails that will determine the bias. The longer history of the quarterly CPI data indicates that there is only a small (positive) skew of the distribution (Appendix Figure 5). This typical symmetry of the distribution is an important reason why in the quarterly inflation data the averages of trimmed mean inflation and CPI inflation are identical over the past 32 years. Further details are in the Appendix.
The solution
Fortunately, there is an easy solution by using the new monthly inflation data to construct a series that retains the monthly timeliness but behaves consistently with the quarterly inflation data that the RBA understands well. The trick is to calculate the trimmed mean not on monthly changes in prices but on the three-month change in three-month averages of prices. This mimics the quarterly inflation rate but provides updates each month.
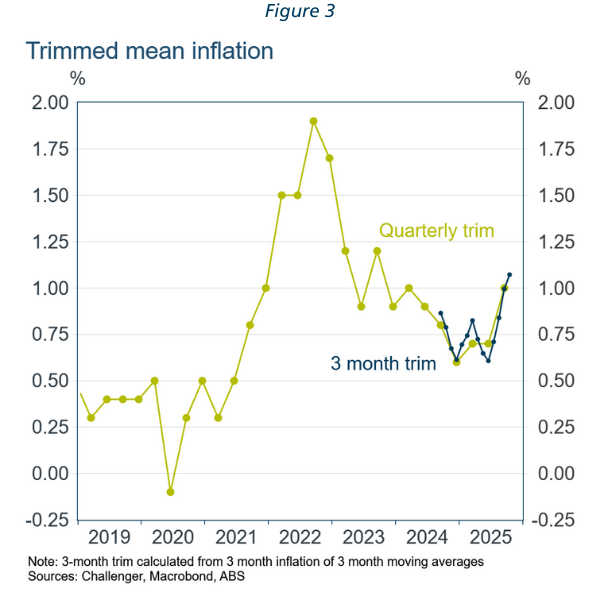
As can be seen in Figure 3, this three-month trim has a similar profile to the quarterly trimmed mean, while providing more frequent reads on inflation pressures. This measure clearly highlights the pick-up in price pressures over recent months.
Quarterly trimmed mean inflation has only exceeded 1% in two episodes in the RBA's 32-year inflation targeting history: the pre-Global Financial Crisis inflation breakout and the post-pandemic inflation surge. With the three-month trimmed mean inflation, which mimics the well-understood quarterly measure, over 1% in October the RBA will be moving from a state of being alert to being (moderately) alarmed.
The pitch
The RBA is full of smart people who will have done similar analysis and likely reached a similar conclusion on the merits of a three-month trim. If it is the focus of RBA policy makers, then this measure should be calculated and published by the ABS (it currently is not).
Appendix
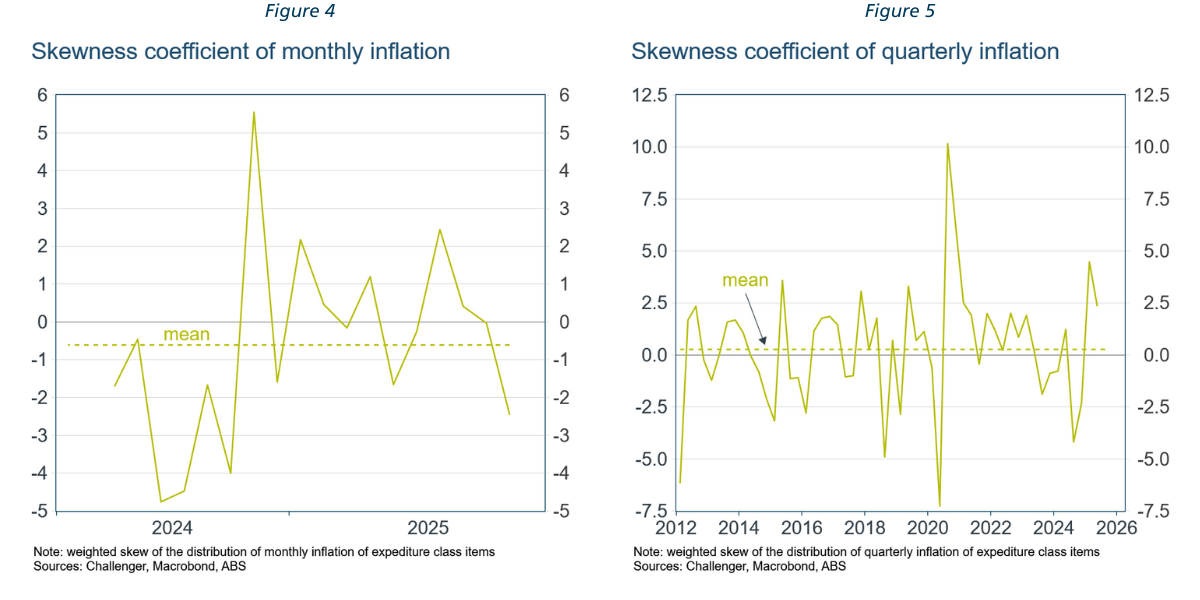
Over the short-history of data available, monthly inflation has on average had a (weighted) negative skew (Figure 4) in contrast to quarterly inflation which has had a slight positive skew (Figure 5). Given the short history of data, it's too early to say whether this negative skew is simply a random sample given the volatility of the skew from period to period or is systematic reflecting the dynamics of price changes from month to month and how they average out over quarters.
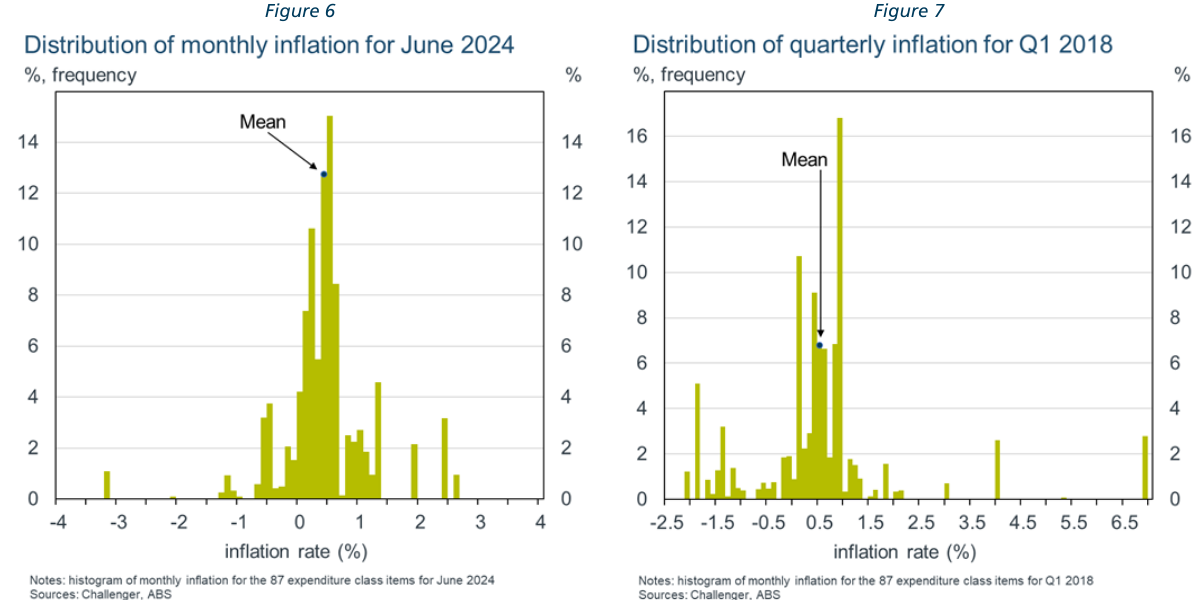
The skewness coefficient is determined by the full distribution of individual component price changes, but the bias in a trimmed mean will only depend on the symmetry of outliers, those components that are trimmed. It is possible that a trimmed mean of a distribution that is systematically negative-skewed will not have systematic bias, for example the June 2024 distribution of monthly price changes had a skew close to the average of –0.6, but a significant contributor to the negative skew was the outlier 3.2% fall in vegetable prices (Figure 6). By contrast, quarterly inflation in Q1 2018 had a large positive outlier, petrol, but a mass of distribution below the mean resulted in the skewness coefficient only being slightly positive, in line with the average over the post 2011 sample (Figure 7).
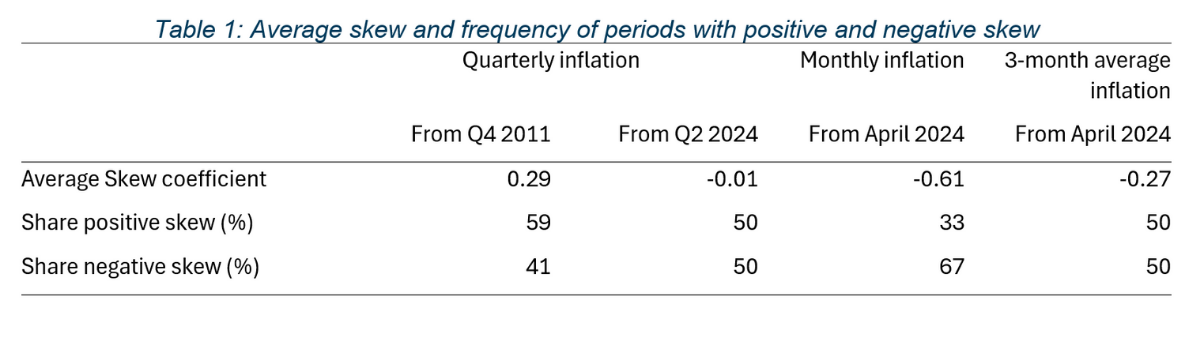
Table 1 shows the average skew of the monthly and quarterly distribution of component price changes. The three-month average inflation distribution has a smaller average negative skew, –0.27, than monthly inflation, –0.61, and, like quarterly inflation over the same period, has an equal number of months with negative and positive skew.
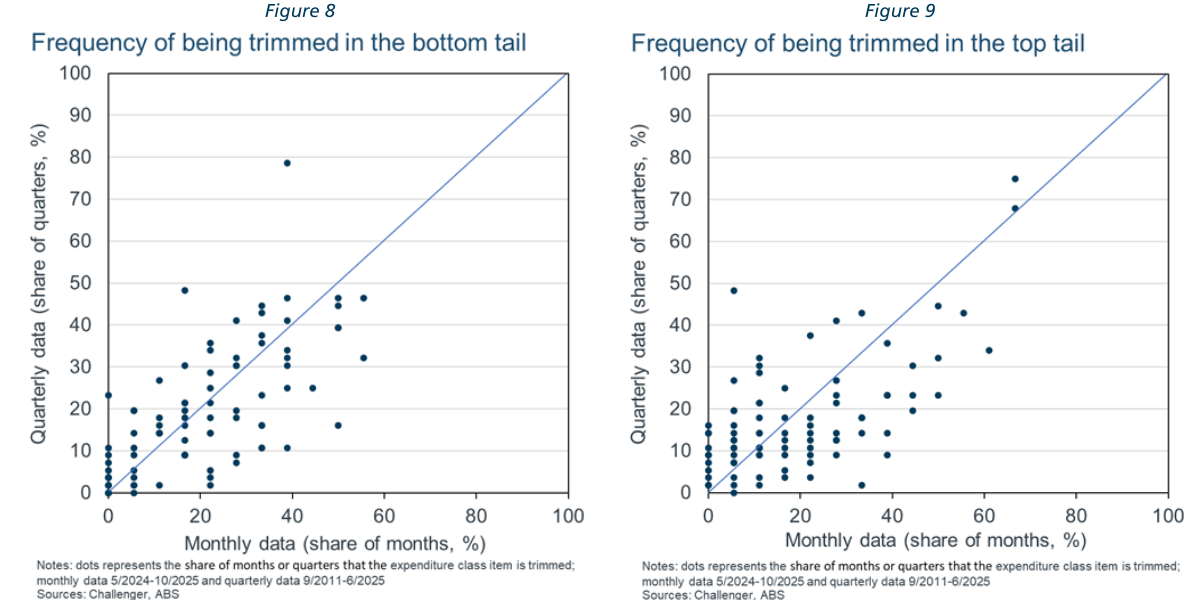
It is too early to tell whether the monthly trimmed mean will have systematic bias relative to CPI inflation (that is, have a higher average). One driver of systematic bias could be if monthly price changes of some components have negative autocorrelation, so that component may have an extreme price change in one month, and be trimmed, but have a more moderate quarterly price change and so not be trimmed. Figure 8 and Figure 9 show the share of months or quarters that each of the 87 individual components are trimmed in the bottom and top tails of the distribution in the monthly and quarterly trims. Clearly some items have been trimmed more often in the monthly or quarterly trim, but most component dots are close to the 450 line indicating that their frequency of being trimmed is similar in the monthly and quarterly trims. There are no clear outliers that are frequently being trimmed in the monthly measure but not the quarterly measure.