Macro Musing: Household consumption - I Wanna Spend with Somebody

Subscribe to Macro Musing
To stay up to date on the latest economic insights, subscribe to Macro Musing on LinkedIn.
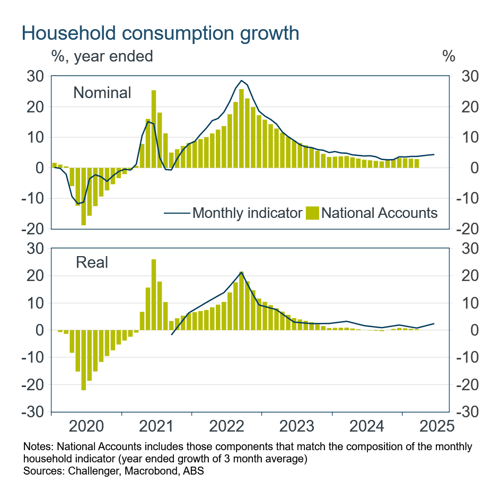
Household spending is picking up, although at a slower pace than had been expected. The weakness in consumption has been an important contributor to the general economic malaise. The impending rate cut from the RBA will provide some boost and the RBA will be carefully monitoring consumption to discern the pace of following cuts. Fortunately, it now has better data to map households’ consumption.
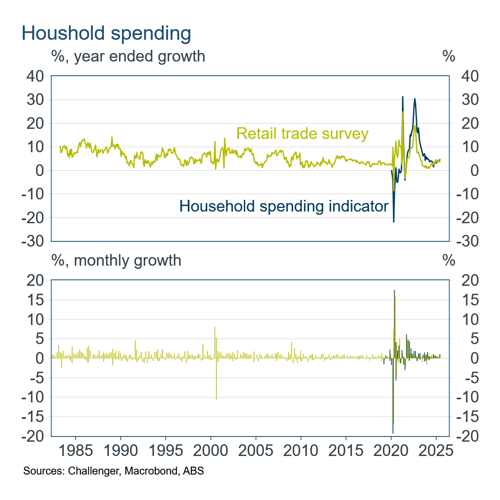
Last week the Australian Bureau of Statistics (ABS) published its last retail trade survey, bringing to an end a 75 year history. It has been discontinued because of the success of the ABS’ Monthly Household Spending Indicator (MHSI), first published in the COVID-19 pandemic. The MHSI is compiled from aggregated, de-identified data on bank credit and debit card transactions provided by banks, along with data on supermarket transactions and new vehicle sales.
Households’ changing spending patterns, in particular increased spending on services, necessitated replacing the old retail trade survey of businesses with the MHSI. The retail trade survey did not include households’ spending on services. In 1959-60 it covered 56% of household spending, but by 2022-23 this had fallen to 33%. By comparison, the MHSI currently covers 60% of household consumption, including services. If you’re really keen, the ABS has even produced a video explaining the change.
During the pandemic household spending experienced unprecedented wild swings. Both the retail trade survey and the new household spending indicator rose and fell by more than 10% from month to month. The only time the retail trade survey had seen similar changes was with the introduction of the GST in 2000. With the retail trade survey not including services, and the MHSI being new, it was difficult for the RBA and other economists to assess how consumption was being thrown around by the pandemic.
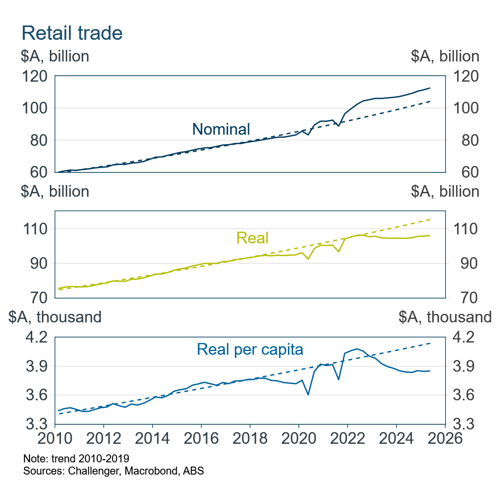
The post pandemic surge in inflation saw retail trade increase to well above its previous trend growth. But of course, adjusting for inflation retail spending had fallen below its trend, both during the pandemic and especially afterward. Accounting for strong population growth, particularly once borders reopened, spending per capita looks even weaker relative to its pre-pandemic trend.
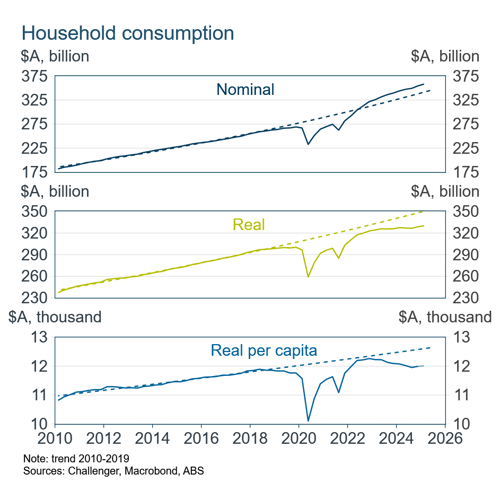
Looking at the broadest measure of consumption from the National Accounts, which includes all goods and services, shows just how weak consumption has been. Real per capita consumption is $12,000, 5% below where its pre-pandemic trend suggests it might have been. No wonder the Government is thinking about how to boost economic growth with its productivity summit in a couple of weeks.